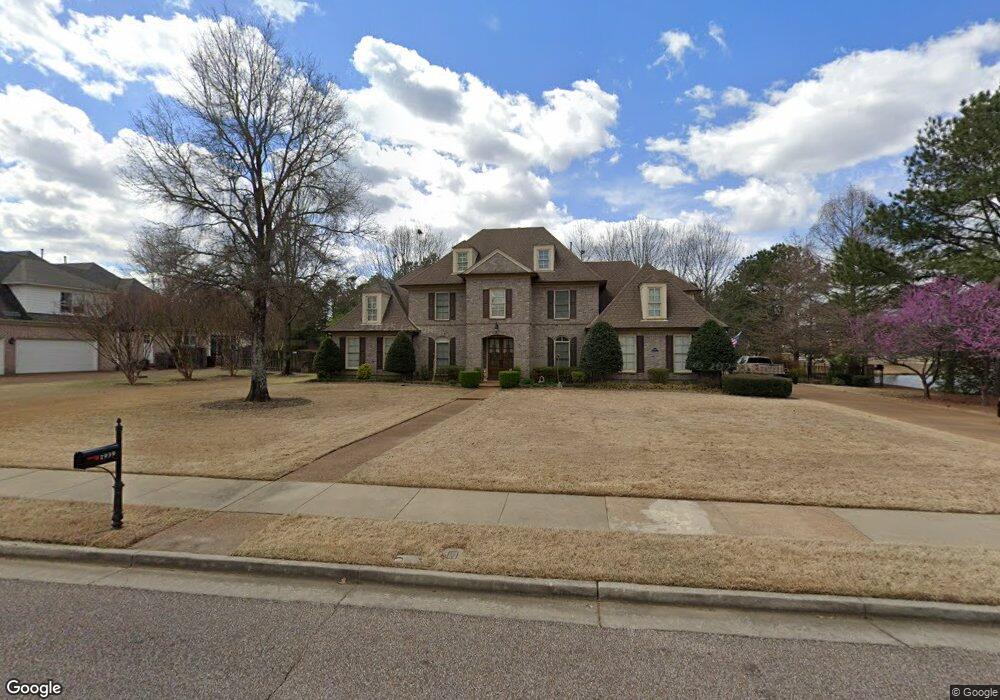
1939 Brooks Bend Rd Collierville, TN 38017
Estimated Value: $677,000 - $710,783
4
Beds
5
Baths
4,858
Sq Ft
$143/Sq Ft
Est. Value
About This Home
This home is located at 1939 Brooks Bend Rd, Collierville, TN 38017 and is currently estimated at $694,196, approximately $142 per square foot. 1939 Brooks Bend Rd is a home located in Shelby County with nearby schools including Bailey Station Elementary School, West Collierville Middle School, and Collierville High School.
Ownership History
Date
Name
Owned For
Owner Type
Purchase Details
Closed on
Sep 30, 2022
Sold by
Laschober David K
Bought by
David And Kimberly Laschober Living Trust
Current Estimated Value
Purchase Details
Closed on
Jun 29, 2007
Sold by
Franks Ronald and Franks Shannon
Bought by
Laschober David K and Laschober Kimberly A
Home Financials for this Owner
Home Financials are based on the most recent Mortgage that was taken out on this home.
Original Mortgage
$320,000
Interest Rate
6.37%
Mortgage Type
Unknown
Purchase Details
Closed on
Aug 8, 2003
Sold by
Holder Robert S and Holder Barbara S
Bought by
Franks Ronald and Franks Shannon
Purchase Details
Closed on
Jun 27, 2002
Sold by
Riverbirch Memphis Llc
Bought by
Holder Robert S and Holder Barbara S
Home Financials for this Owner
Home Financials are based on the most recent Mortgage that was taken out on this home.
Original Mortgage
$190,000
Interest Rate
5.87%
Create a Home Valuation Report for This Property
The Home Valuation Report is an in-depth analysis detailing your home's value as well as a comparison with similar homes in the area
Home Values in the Area
Average Home Value in this Area
Purchase History
| Date | Buyer | Sale Price | Title Company |
|---|---|---|---|
| David And Kimberly Laschober Living Trust | -- | -- | |
| Laschober David K | $460,000 | Professional Title & Escrow | |
| Franks Ronald | $395,000 | -- | |
| Holder Robert S | $381,712 | Memphis Title Company |
Source: Public Records
Mortgage History
| Date | Status | Borrower | Loan Amount |
|---|---|---|---|
| Previous Owner | Laschober David K | $320,000 | |
| Previous Owner | Holder Robert S | $190,000 |
Source: Public Records
Tax History Compared to Growth
Tax History
| Year | Tax Paid | Tax Assessment Tax Assessment Total Assessment is a certain percentage of the fair market value that is determined by local assessors to be the total taxable value of land and additions on the property. | Land | Improvement |
|---|---|---|---|---|
| 2025 | $4,840 | $185,075 | $32,625 | $152,450 |
| 2024 | $4,840 | $142,775 | $32,625 | $110,150 |
| 2023 | $7,467 | $142,775 | $32,625 | $110,150 |
| 2022 | $7,296 | $142,775 | $32,625 | $110,150 |
| 2021 | $7,381 | $142,775 | $32,625 | $110,150 |
| 2020 | $7,613 | $129,475 | $32,625 | $96,850 |
| 2019 | $5,244 | $129,475 | $32,625 | $96,850 |
| 2018 | $5,244 | $129,475 | $32,625 | $96,850 |
| 2017 | $5,321 | $129,475 | $32,625 | $96,850 |
| 2016 | $5,249 | $120,125 | $0 | $0 |
| 2014 | $5,249 | $120,125 | $0 | $0 |
Source: Public Records
Map
Nearby Homes
- 1931 Katz Place
- 1941 Lonhill Dr
- 9940 Houston Oaks Dr
- 1893 Hartwell Manor W
- 9890 S Houston Way
- 1955 Coors Creek Dr
- 1923 Swynford Ln
- 10094 Bushrod Cove
- 9907 S Houston Oak Dr
- 1911 Swynford Ln
- 2069 Standing Rock Ave
- 10018 Bushrod Cove
- 2195 Houston Pass
- 2087 Standing Rock Ave
- 1924 Laurel Ln
- 9884 S Houston Oak Dr
- 1842 Swynford Ln
- 2106 Carisbrooke Dr
- 1715 Powell Run Cove
- 10223 Poston Oak Cove
- 1923 Brooks Bend Rd
- 1938 Brooks Bend Rd
- 1946 Brooks Bend Rd
- 1977 S Templeton Cir
- 1954 Brooks Bend Rd
- 1905 Brooks Bend Rd
- 1962 Brooks Bend Rd
- 1965 S Templeton Cir
- 1976 Almadale Farms Pkwy
- 1927 Katz Place
- 1972 Brooks Bend Rd
- 1923 Katz Place
- 1966 Almadale Farms Pkwy
- 1955 S Templeton Cir
- 1963 N Templeton Cir
- 9982 Westwood Manor Dr
- 1950 N Templeton Cir
- 1883 Greystoke Ln
- 1956 Almadale Farms Pkwy
- 9978 Westwood Manor Dr