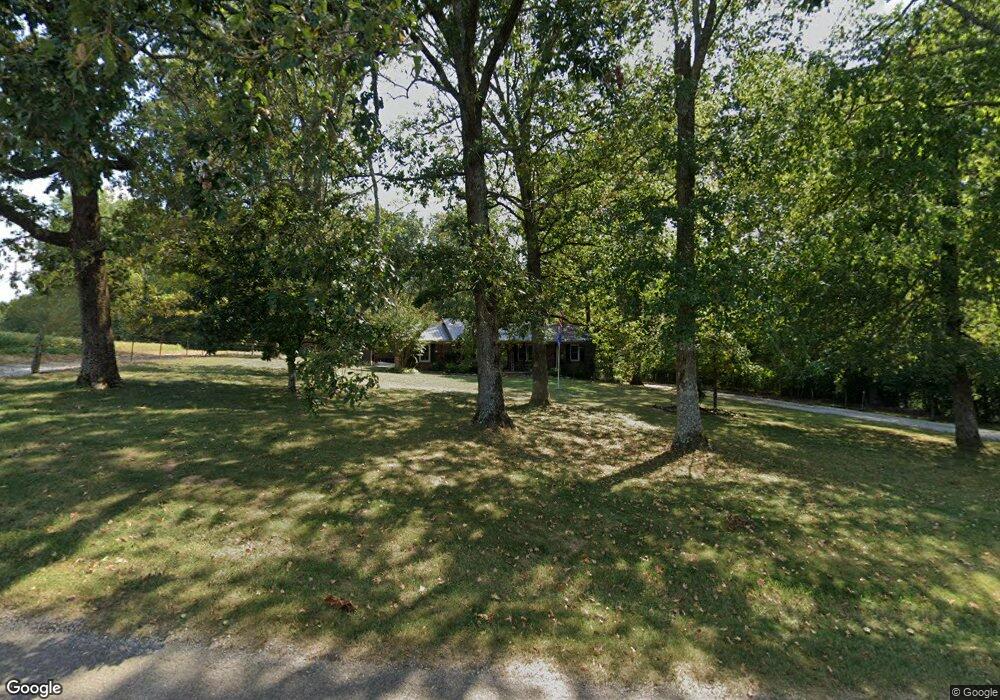
1939 Jared Rd Walling, TN 38587
Estimated Value: $198,384 - $337,000
Studio
2
Baths
1,148
Sq Ft
$239/Sq Ft
Est. Value
About This Home
This home is located at 1939 Jared Rd, Walling, TN 38587 and is currently estimated at $274,596, approximately $239 per square foot. 1939 Jared Rd is a home located in White County with nearby schools including Cassville Elementary School, White County Middle School, and White County High School.
Ownership History
Date
Name
Owned For
Owner Type
Purchase Details
Closed on
Nov 12, 2024
Sold by
Mcfall James and Mcfall Jean D
Bought by
Mcfall James and Mcfall Jean D
Current Estimated Value
Purchase Details
Closed on
May 12, 2021
Sold by
White Ruth C and Orr Linda
Bought by
Frazier Addam and Lee Shon
Home Financials for this Owner
Home Financials are based on the most recent Mortgage that was taken out on this home.
Original Mortgage
$45,000
Interest Rate
3%
Mortgage Type
Purchase Money Mortgage
Purchase Details
Closed on
Apr 16, 2021
Sold by
Mcfall Jean
Bought by
Hauk Timothy and Hauk Jean
Home Financials for this Owner
Home Financials are based on the most recent Mortgage that was taken out on this home.
Original Mortgage
$45,000
Interest Rate
3%
Mortgage Type
Purchase Money Mortgage
Purchase Details
Closed on
Jun 30, 1977
Bought by
Mcfall James and Mcfall Ean D
Create a Home Valuation Report for This Property
The Home Valuation Report is an in-depth analysis detailing your home's value as well as a comparison with similar homes in the area
Purchase History
| Date | Buyer | Sale Price | Title Company |
|---|---|---|---|
| Mcfall James | -- | None Listed On Document | |
| Frazier Addam | $26,600 | None Listed On Document | |
| Hauk Timothy | $50,000 | Franklin Jack | |
| Mcfall James | -- | -- |
Source: Public Records
Mortgage History
| Date | Status | Borrower | Loan Amount |
|---|---|---|---|
| Previous Owner | Hauk Timothy | $45,000 |
Source: Public Records
Tax History
| Year | Tax Paid | Tax Assessment Tax Assessment Total Assessment is a certain percentage of the fair market value that is determined by local assessors to be the total taxable value of land and additions on the property. | Land | Improvement |
|---|---|---|---|---|
| 2025 | $736 | $52,200 | $3,750 | $48,450 |
| 2024 | $628 | $30,650 | $2,750 | $27,900 |
| 2023 | $628 | $30,650 | $2,750 | $27,900 |
| 2022 | $628 | $30,650 | $2,750 | $27,900 |
| 2021 | $628 | $30,650 | $2,750 | $27,900 |
| 2020 | $628 | $30,650 | $2,750 | $27,900 |
| 2019 | $440 | $21,475 | $2,125 | $19,350 |
| 2018 | $440 | $21,475 | $2,125 | $19,350 |
| 2017 | $440 | $21,475 | $2,125 | $19,350 |
| 2016 | $440 | $21,475 | $2,125 | $19,350 |
| 2015 | $397 | $21,475 | $2,125 | $19,350 |
| 2014 | -- | $21,475 | $2,125 | $19,350 |
| 2013 | -- | $21,025 | $1,950 | $19,075 |
Source: Public Records
Map
Nearby Homes
- 1248 Lowery Rd
- 618 Cashdollar Rd
- 618 Cash Dollar Rd
- 0 Old Kentucky Rd
- LOT 3 Old Kentucky Rd
- 1295 Darkey Springs Rd
- 4200 #3 Will Thompson Rd
- 4200 #5 Will Thompson Rd
- 4200 #2 Will Thompson Rd
- 4200 #4 Will Thompson Rd
- 4200 #6 Will Thompson Rd
- 4200 #1 Will Thompson Rd
- 11.38ac Will Thompson Rd
- 4761 Gum Springs Mountain Rd
- 131 Collingwood Rd
- 0 Center Point Acres N Unit 1322803
- 0 Center Point Acres N Unit 240744
- 0 Center Point Acres N Unit RTC3050083
- 265 N Center Point Acres
- 13400 Old Kentucky Rd
- 1807 Jared Rd
- 1657 Jared Rd
- Corner Old Kentucky Rd at Jared Rd
- 0 Old Kentucy Rd at Jared Rd Unit RTC2972179
- 0 Old Kentucy Rd at Jared Rd Unit 1191441
- 11919 Old Kentucky Rd
- 11799 Old Kentucky Rd
- 1346 Jared Rd
- 1544 Jared Rd
- 11574 Old Kentucky Rd
- 11839 Old Kentucky Rd
- 11899 11899 Old Kentucky Rd
- 11879 Old Kentucky Rd
- 1632 Jared Rd
- 11899 Old Kentucky Rd
- 1595 Jared Rd
- 11919 Old Kentucky Rd
- 11920 Old Kentucky Rd Unit 12111
- 00 Midnight Ln
- 11939 Old Kentucky Rd
Your Personal Tour Guide
Ask me questions while you tour the home.