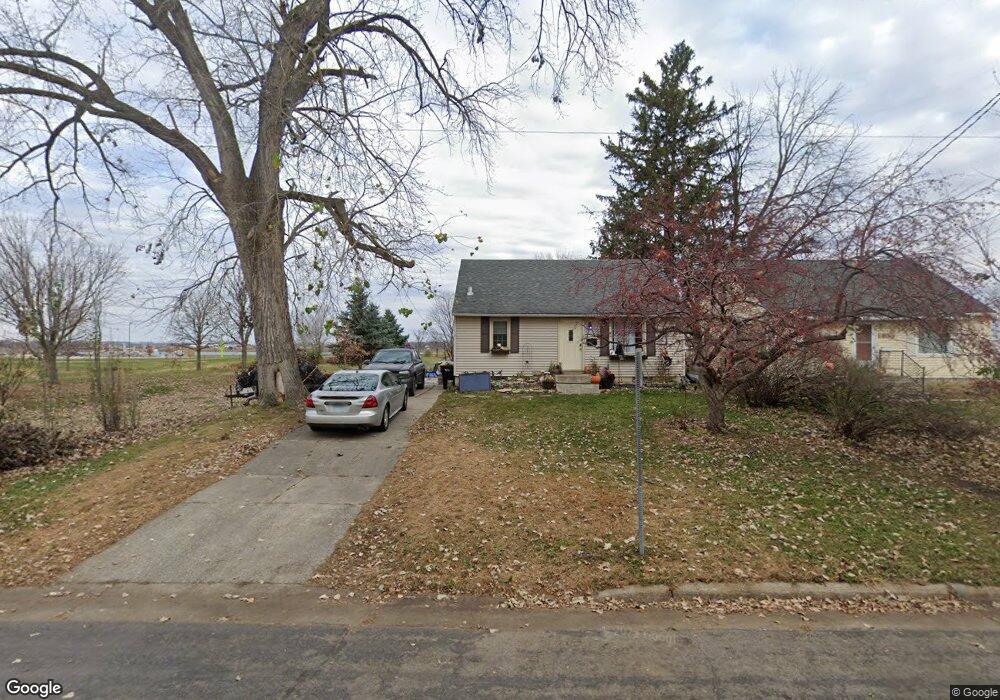
1939 W Center St Rochester, MN 55902
Estimated Value: $226,000 - $289,000
3
Beds
1
Bath
1,332
Sq Ft
$188/Sq Ft
Est. Value
About This Home
This home is located at 1939 W Center St, Rochester, MN 55902 and is currently estimated at $249,826, approximately $187 per square foot. 1939 W Center St is a home located in Olmsted County with nearby schools including John Adams Middle School, John Marshall Senior High School, and Primrose School of Rochester.
Ownership History
Date
Name
Owned For
Owner Type
Purchase Details
Closed on
Dec 21, 2011
Sold by
Minnesota Housing Finance Agency
Bought by
Docken Holly A
Current Estimated Value
Home Financials for this Owner
Home Financials are based on the most recent Mortgage that was taken out on this home.
Original Mortgage
$55,555
Outstanding Balance
$37,967
Interest Rate
3.99%
Mortgage Type
FHA
Estimated Equity
$211,859
Purchase Details
Closed on
Apr 29, 2011
Sold by
Heinonen Patrick H and Heinonen Rachel C
Bought by
Minnesota Housing Finance Agency
Purchase Details
Closed on
Jun 28, 2006
Sold by
Pharo Jessica Jo
Bought by
Heinonen Patrick H and Heinonen Rachel C
Home Financials for this Owner
Home Financials are based on the most recent Mortgage that was taken out on this home.
Original Mortgage
$120,000
Interest Rate
6.68%
Mortgage Type
New Conventional
Create a Home Valuation Report for This Property
The Home Valuation Report is an in-depth analysis detailing your home's value as well as a comparison with similar homes in the area
Home Values in the Area
Average Home Value in this Area
Purchase History
| Date | Buyer | Sale Price | Title Company |
|---|---|---|---|
| Docken Holly A | $57,000 | Edina Title Rochester | |
| Minnesota Housing Finance Agency | $121,725 | None Available | |
| Heinonen Patrick H | $120,000 | None Available |
Source: Public Records
Mortgage History
| Date | Status | Borrower | Loan Amount |
|---|---|---|---|
| Open | Docken Holly A | $55,555 | |
| Previous Owner | Heinonen Patrick H | $120,000 |
Source: Public Records
Tax History Compared to Growth
Tax History
| Year | Tax Paid | Tax Assessment Tax Assessment Total Assessment is a certain percentage of the fair market value that is determined by local assessors to be the total taxable value of land and additions on the property. | Land | Improvement |
|---|---|---|---|---|
| 2024 | $2,612 | $207,200 | $35,000 | $172,200 |
| 2023 | $2,644 | $207,200 | $35,000 | $172,200 |
| 2022 | $2,344 | $184,800 | $35,000 | $149,800 |
| 2021 | $2,130 | $163,400 | $30,000 | $133,400 |
| 2020 | $1,994 | $154,700 | $30,000 | $124,700 |
| 2019 | $1,594 | $138,800 | $20,000 | $118,800 |
| 2018 | $1,346 | $133,000 | $20,000 | $113,000 |
| 2017 | $1,222 | $124,300 | $20,000 | $104,300 |
| 2016 | $1,232 | $79,200 | $14,800 | $64,400 |
| 2015 | $1,142 | $78,600 | $14,800 | $63,800 |
| 2014 | $1,112 | $78,600 | $14,800 | $63,800 |
| 2012 | -- | $78,300 | $14,774 | $63,526 |
Source: Public Records
Map
Nearby Homes
- 1749 1st St SW
- 327 20th Ave SW
- 405 18 1 2 Ave SW
- 406 18th Ave SW
- 501 20th Ave SW
- 1426 1st St NW
- 2005 Hill Place SW
- 1235 2nd St NW
- 625 Folwell Ln SW
- 1516 5th St SW
- 430 15th Ave SW
- 1221 1st St NW
- 1744 7th St SW
- 785 Brandon Ln SW
- 17 Conner Cir SW
- 910 Folwell Dr SW
- 1728 8th St SW
- 360 Wimbledon Hills Dr SW
- 2472 Gates Dr SW
- 2001 Folwell Dr SW
- 1939 1939 Center-Street-sw
- 1933 W Center St
- 1929 W Center St
- 1930 1st St NW
- 1921 W Center St
- 1938 W Center St
- 1934 W Center St
- 1924 1st St NW
- 1930 1930 Center-Street-w
- 1930 W Center St
- 1934 1st St NW
- 1924 W Center St
- 1918 1918 1st-Street-nw
- 1915 W Center St
- 1918 1st St NW
- 1920 W Center St
- 1911 W Center St
- 19 19th Ave NW
- 1910 1st St NW
- 1910 1910 1st-Street-nw