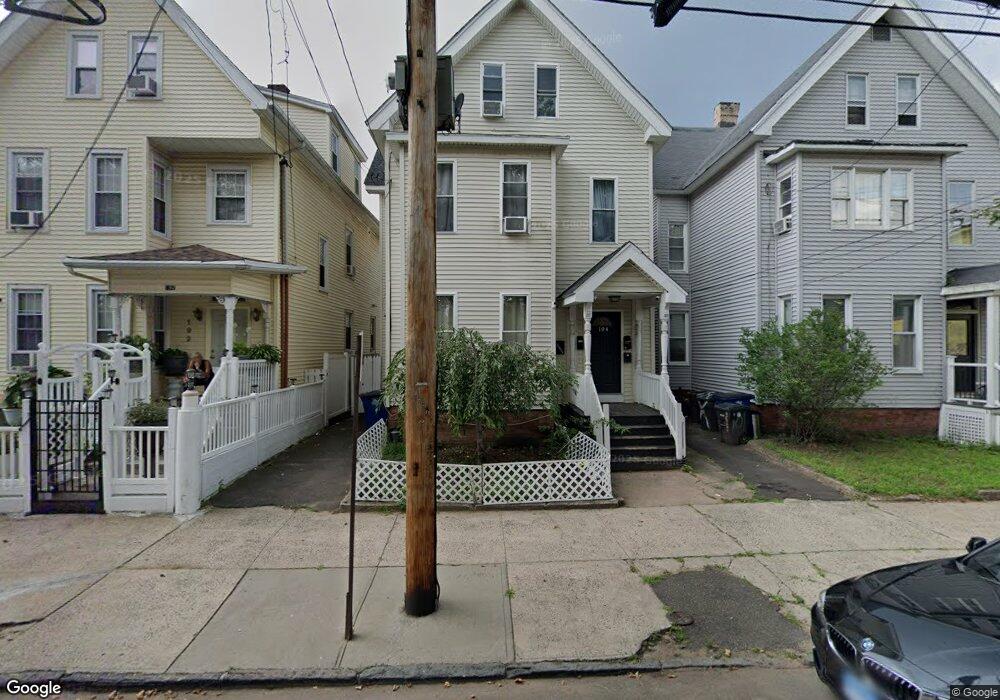
194 James St New Haven, CT 06513
Fair Haven NeighborhoodEstimated Value: $282,258 - $405,000
5
Beds
3
Baths
2,686
Sq Ft
$129/Sq Ft
Est. Value
About This Home
This home is located at 194 James St, New Haven, CT 06513 and is currently estimated at $346,815, approximately $129 per square foot. 194 James St is a home located in New Haven County with nearby schools including Elm City College Preparatory School, Cold Spring School, and St Francis & St Rose Of Lima School.
Ownership History
Date
Name
Owned For
Owner Type
Purchase Details
Closed on
Aug 17, 2022
Sold by
Celone Richard
Bought by
Montalvo Vianka N
Current Estimated Value
Home Financials for this Owner
Home Financials are based on the most recent Mortgage that was taken out on this home.
Original Mortgage
$220,924
Outstanding Balance
$210,857
Interest Rate
5.3%
Mortgage Type
FHA
Estimated Equity
$135,958
Purchase Details
Closed on
Sep 15, 2008
Sold by
New Haven City Of
Bought by
Celone Richard
Home Financials for this Owner
Home Financials are based on the most recent Mortgage that was taken out on this home.
Original Mortgage
$95,000
Interest Rate
12%
Mortgage Type
Purchase Money Mortgage
Purchase Details
Closed on
Apr 8, 1993
Sold by
Shawmut Bk Ct
Bought by
Department Of Housing & Urban Dev
Create a Home Valuation Report for This Property
The Home Valuation Report is an in-depth analysis detailing your home's value as well as a comparison with similar homes in the area
Home Values in the Area
Average Home Value in this Area
Purchase History
| Date | Buyer | Sale Price | Title Company |
|---|---|---|---|
| Montalvo Vianka N | $225,000 | None Available | |
| Celone Richard | $79,000 | -- | |
| Department Of Housing & Urban Dev | $102,000 | -- |
Source: Public Records
Mortgage History
| Date | Status | Borrower | Loan Amount |
|---|---|---|---|
| Open | Montalvo Vianka N | $220,924 | |
| Previous Owner | Department Of Housing & Urban Dev | $112,000 | |
| Previous Owner | Department Of Housing & Urban Dev | $95,000 | |
| Previous Owner | Department Of Housing & Urban Dev | $51,000 |
Source: Public Records
Tax History Compared to Growth
Tax History
| Year | Tax Paid | Tax Assessment Tax Assessment Total Assessment is a certain percentage of the fair market value that is determined by local assessors to be the total taxable value of land and additions on the property. | Land | Improvement |
|---|---|---|---|---|
| 2025 | $8,335 | $211,540 | $38,220 | $173,320 |
| 2024 | $8,144 | $211,540 | $38,220 | $173,320 |
| 2023 | $7,869 | $211,540 | $38,220 | $173,320 |
| 2022 | $8,409 | $211,540 | $38,220 | $173,320 |
| 2021 | $5,434 | $123,830 | $30,590 | $93,240 |
| 2020 | $5,434 | $123,830 | $30,590 | $93,240 |
| 2019 | $5,322 | $123,830 | $30,590 | $93,240 |
| 2018 | $5,322 | $123,830 | $30,590 | $93,240 |
| 2017 | $4,790 | $123,830 | $30,590 | $93,240 |
| 2016 | $3,688 | $88,760 | $13,930 | $74,830 |
| 2015 | $3,688 | $88,760 | $13,930 | $74,830 |
| 2014 | $3,688 | $88,760 | $13,930 | $74,830 |
Source: Public Records
Map
Nearby Homes