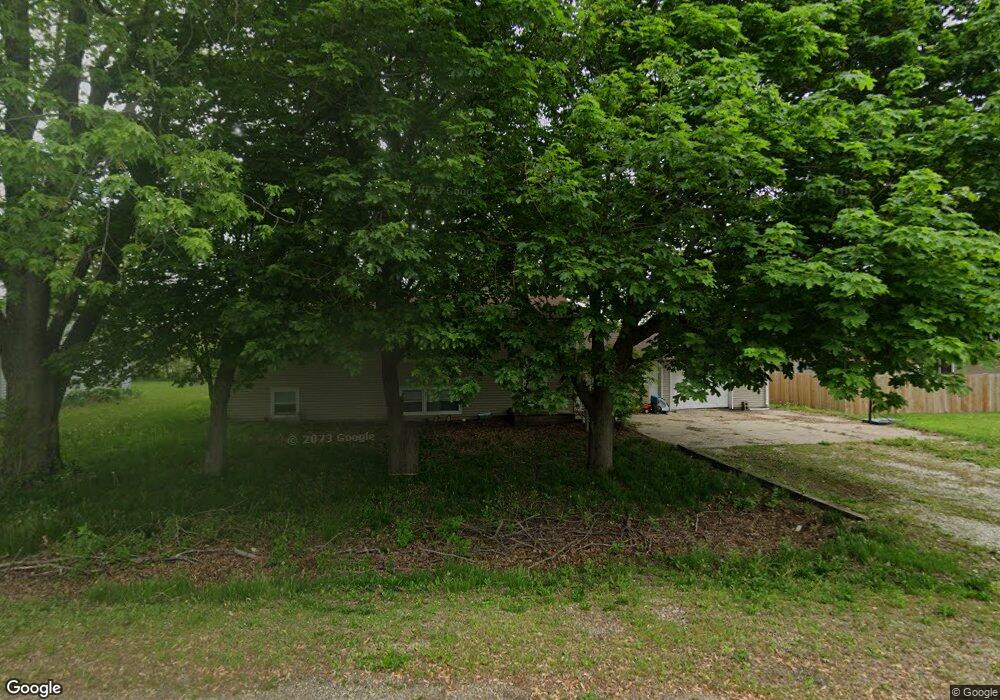
194 Roy El Ct Wapello, IA 52653
Estimated Value: $143,501 - $219,000
3
Beds
2
Baths
1,056
Sq Ft
$162/Sq Ft
Est. Value
About This Home
This home is located at 194 Roy El Ct, Wapello, IA 52653 and is currently estimated at $171,375, approximately $162 per square foot. 194 Roy El Ct is a home located in Louisa County with nearby schools including Wapello Elementary School and Wapello Senior High School.
Ownership History
Date
Name
Owned For
Owner Type
Purchase Details
Closed on
Nov 29, 2023
Sold by
Smith Darin William and Lynn Ann
Bought by
Brockway Holden R and Brockway Abby L
Current Estimated Value
Purchase Details
Closed on
Sep 15, 2006
Sold by
Thornburg Roger R and Thornburg Jacqueline G
Bought by
Smith Darin William and Smith Lynn Ann
Home Financials for this Owner
Home Financials are based on the most recent Mortgage that was taken out on this home.
Original Mortgage
$94,000
Interest Rate
6.59%
Mortgage Type
New Conventional
Create a Home Valuation Report for This Property
The Home Valuation Report is an in-depth analysis detailing your home's value as well as a comparison with similar homes in the area
Home Values in the Area
Average Home Value in this Area
Purchase History
| Date | Buyer | Sale Price | Title Company |
|---|---|---|---|
| Brockway Holden R | $90,000 | None Listed On Document | |
| Smith Darin William | -- | None Available |
Source: Public Records
Mortgage History
| Date | Status | Borrower | Loan Amount |
|---|---|---|---|
| Previous Owner | Smith Darin William | $94,000 |
Source: Public Records
Tax History Compared to Growth
Tax History
| Year | Tax Paid | Tax Assessment Tax Assessment Total Assessment is a certain percentage of the fair market value that is determined by local assessors to be the total taxable value of land and additions on the property. | Land | Improvement |
|---|---|---|---|---|
| 2025 | $2,252 | $140,850 | $17,730 | $123,120 |
| 2024 | $2,266 | $131,450 | $17,730 | $113,720 |
| 2023 | $2,266 | $131,450 | $17,730 | $113,720 |
| 2022 | $2,076 | $115,790 | $17,730 | $98,060 |
| 2021 | $2,008 | $115,790 | $17,730 | $98,060 |
| 2020 | $1,998 | $106,110 | $17,730 | $88,380 |
| 2019 | $2,006 | $106,110 | $17,730 | $88,380 |
| 2018 | $1,980 | $106,110 | $17,730 | $88,380 |
| 2017 | $1,946 | $100,590 | $0 | $0 |
| 2016 | $2,044 | $100,590 | $17,730 | $82,860 |
| 2015 | $2,038 | $100,590 | $17,730 | $82,860 |
| 2014 | $2,064 | $97,370 | $10,490 | $86,880 |
Source: Public Records
Map
Nearby Homes