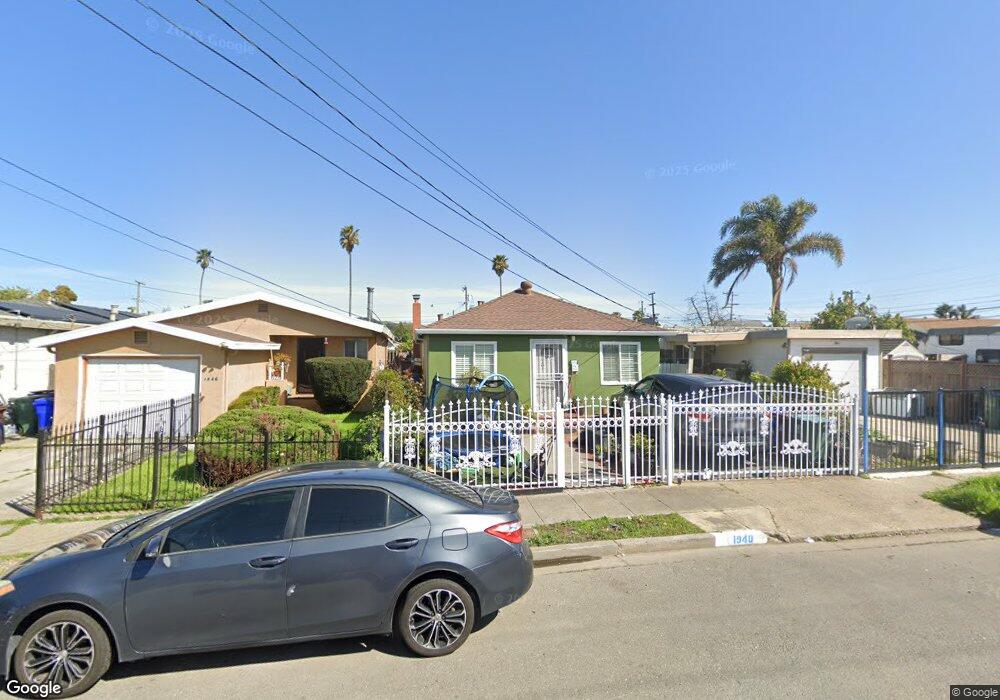
1940 21st St San Pablo, CA 94806
Estimated Value: $421,000 - $542,000
2
Beds
1
Bath
1,242
Sq Ft
$389/Sq Ft
Est. Value
About This Home
This home is located at 1940 21st St, San Pablo, CA 94806 and is currently estimated at $483,616, approximately $389 per square foot. 1940 21st St is a home located in Contra Costa County with nearby schools including Dover Elementary School, Walter T. Helms Middle School, and Richmond High School.
Ownership History
Date
Name
Owned For
Owner Type
Purchase Details
Closed on
Sep 11, 2023
Sold by
Ponce Ramon
Bought by
Ponce Jasmine
Current Estimated Value
Purchase Details
Closed on
Jul 3, 1996
Sold by
Ponce Ramon
Bought by
Ponce Ramon and Ponce Victoria
Home Financials for this Owner
Home Financials are based on the most recent Mortgage that was taken out on this home.
Original Mortgage
$96,766
Interest Rate
7.97%
Mortgage Type
Purchase Money Mortgage
Purchase Details
Closed on
May 24, 1996
Sold by
Ponce Victoria
Bought by
Ponce Ramon
Home Financials for this Owner
Home Financials are based on the most recent Mortgage that was taken out on this home.
Original Mortgage
$96,766
Interest Rate
7.97%
Mortgage Type
Purchase Money Mortgage
Purchase Details
Closed on
Dec 27, 1995
Sold by
Navarro Leonard J
Bought by
Arlington Investment Company
Create a Home Valuation Report for This Property
The Home Valuation Report is an in-depth analysis detailing your home's value as well as a comparison with similar homes in the area
Home Values in the Area
Average Home Value in this Area
Purchase History
| Date | Buyer | Sale Price | Title Company |
|---|---|---|---|
| Ponce Jasmine | -- | None Listed On Document | |
| Ponce Ramon | -- | -- | |
| Ponce Ramon | -- | Chicago Title Co | |
| Ponce Ramon | $97,000 | Chicago Title Co | |
| Arlington Investment Company | $30,000 | -- |
Source: Public Records
Mortgage History
| Date | Status | Borrower | Loan Amount |
|---|---|---|---|
| Previous Owner | Ponce Ramon | $96,766 |
Source: Public Records
Tax History Compared to Growth
Tax History
| Year | Tax Paid | Tax Assessment Tax Assessment Total Assessment is a certain percentage of the fair market value that is determined by local assessors to be the total taxable value of land and additions on the property. | Land | Improvement |
|---|---|---|---|---|
| 2025 | $5,472 | $335,767 | $230,223 | $105,544 |
| 2024 | $3,118 | $329,184 | $225,709 | $103,475 |
| 2023 | $3,118 | $155,264 | $79,822 | $75,442 |
| 2022 | $3,058 | $152,220 | $78,257 | $73,963 |
| 2021 | $3,021 | $149,236 | $76,723 | $72,513 |
| 2019 | $2,870 | $144,812 | $74,449 | $70,363 |
| 2018 | $2,745 | $141,974 | $72,990 | $68,984 |
| 2017 | $2,657 | $139,191 | $71,559 | $67,632 |
| 2016 | $2,588 | $136,462 | $70,156 | $66,306 |
| 2015 | $2,548 | $134,414 | $69,103 | $65,311 |
| 2014 | $2,531 | $131,782 | $67,750 | $64,032 |
Source: Public Records
Map
Nearby Homes
- 1945 21st St
- 1971 23rd St
- 2020 19th St
- 1800 Post Ave
- 1961 Regello Ct
- 1976 Van Ness St
- 1780 Road 20
- 2376 Bush Ave
- 1527 24th St
- 1840 Pullman St
- 2420 Bush Ave
- 1617 17th St
- 1552 Marelia Ct
- 1905 Lovegrove Ave
- 1706 14th St
- 2808 Chattleton Ln
- 2814 Chattleton Ln
- 2818 Chattleton Ln
- 1337 24th St
- 1616 Pine Ave