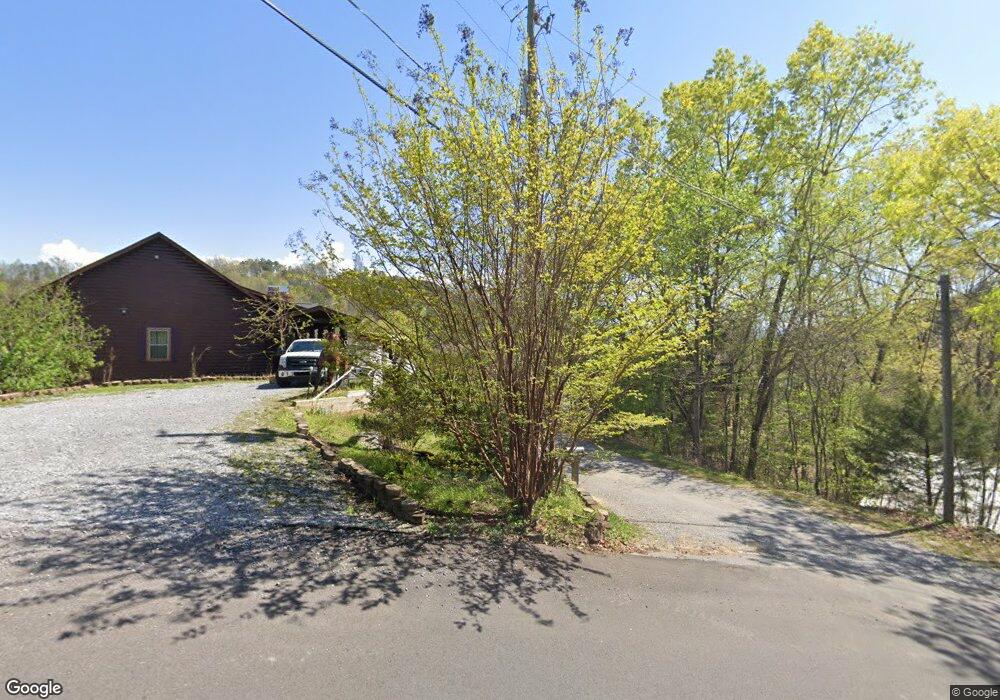
1940 Backhome Ln Unit 19402 Sevierville, TN 37876
Estimated Value: $839,443
--
Bed
2
Baths
1,536
Sq Ft
$547/Sq Ft
Est. Value
About This Home
This home is located at 1940 Backhome Ln Unit 19402, Sevierville, TN 37876 and is currently estimated at $839,443, approximately $546 per square foot. 1940 Backhome Ln Unit 19402 is a home located in Sevier County with nearby schools including Catons Chapel Elementary School, Jones Cove Elementary School, and Northview Elementary School.
Ownership History
Date
Name
Owned For
Owner Type
Purchase Details
Closed on
Nov 22, 2024
Sold by
Saluda Grade Short Term Rental Inc
Bought by
Bespokebnb Holdings Llc
Current Estimated Value
Home Financials for this Owner
Home Financials are based on the most recent Mortgage that was taken out on this home.
Original Mortgage
$668,000
Outstanding Balance
$661,859
Interest Rate
6.54%
Mortgage Type
New Conventional
Estimated Equity
$177,584
Purchase Details
Closed on
May 11, 2022
Sold by
Bridge Matthew R and Bridge Sarah S
Bought by
Saluda Grade Short Term Rental Inc
Purchase Details
Closed on
Feb 20, 2020
Sold by
Layton Carl S and Layton Debra L
Bought by
Bridge Matthew R and Bridge Sarah S
Home Financials for this Owner
Home Financials are based on the most recent Mortgage that was taken out on this home.
Original Mortgage
$326,777
Interest Rate
3.6%
Mortgage Type
New Conventional
Create a Home Valuation Report for This Property
The Home Valuation Report is an in-depth analysis detailing your home's value as well as a comparison with similar homes in the area
Home Values in the Area
Average Home Value in this Area
Purchase History
| Date | Buyer | Sale Price | Title Company |
|---|---|---|---|
| Bespokebnb Holdings Llc | $835,000 | Wagon Wheel Title | |
| Saluda Grade Short Term Rental Inc | $1,175,000 | New Title Company Name | |
| Bridge Matthew R | $384,444 | Smoky Mountain Title |
Source: Public Records
Mortgage History
| Date | Status | Borrower | Loan Amount |
|---|---|---|---|
| Open | Bespokebnb Holdings Llc | $668,000 | |
| Previous Owner | Bridge Matthew R | $326,777 |
Source: Public Records
Tax History Compared to Growth
Tax History
| Year | Tax Paid | Tax Assessment Tax Assessment Total Assessment is a certain percentage of the fair market value that is determined by local assessors to be the total taxable value of land and additions on the property. | Land | Improvement |
|---|---|---|---|---|
| 2025 | $1,405 | $94,960 | $7,880 | $87,080 |
| 2024 | $1,405 | $94,960 | $7,880 | $87,080 |
| 2023 | $1,405 | $94,960 | $0 | $0 |
| 2022 | $878 | $59,350 | $4,925 | $54,425 |
| 2021 | $878 | $59,350 | $4,925 | $54,425 |
| 2020 | $618 | $59,350 | $4,925 | $54,425 |
| 2019 | $618 | $33,225 | $4,925 | $28,300 |
| 2018 | $618 | $33,225 | $4,925 | $28,300 |
| 2017 | $618 | $33,225 | $4,925 | $28,300 |
| 2016 | $618 | $33,225 | $4,925 | $28,300 |
| 2015 | -- | $31,975 | $0 | $0 |
| 2014 | $521 | $31,969 | $0 | $0 |
Source: Public Records
Map
Nearby Homes
- 2022 Starr Crest Dr
- 1980 Timber Ridge Way
- 1529 Majestic Mountain Dr
- 2042 Starr Crest Dr
- 1864 Blue Tick Way
- 1868 Blue Tick Way
- 2029 Windy Ln
- Lot Bg Fox View Ln
- 2114 Rabbit Point Way
- 1890 Blue Tick Way
- 1956 Timber Ridge Way
- 2069 Lones Branch Ln
- 1830 Blue Tick Way
- 2319 Panther Way
- Lot 10 Bg Fox View Rd
- 1928 Timber Ridge Way
- 1611 Bear Claw Way
- 1850 Timber Ridge Way
- 1785 Red Bone Way
- 0 Walker Trail Tr
- 1940 Backhome Ln
- 1940 Backhome Ln Unit 19401
- 1940 Backhome Ln Unit 1
- 1940 Backhome Ln Unit 3
- 1940 Backhome Ln
- 0 Backhome Way
- 1930 Backhome Ln
- 1946 Lones Branch Ln
- 2.59 Acres Lones Branch Ln
- 2.59 Acre Tract Lones Branch Ln
- 2023 Lones Branch Ln
- 1993 Fox View Ln
- 1930 Walker Trail
- 2011 Starr Crest Dr
- 2011 Timber Ridge Way
- 1924 Walker Trail
- 1990 Fox View
- 2025 Lones Branch Ln
- 1986 Fox View Ln