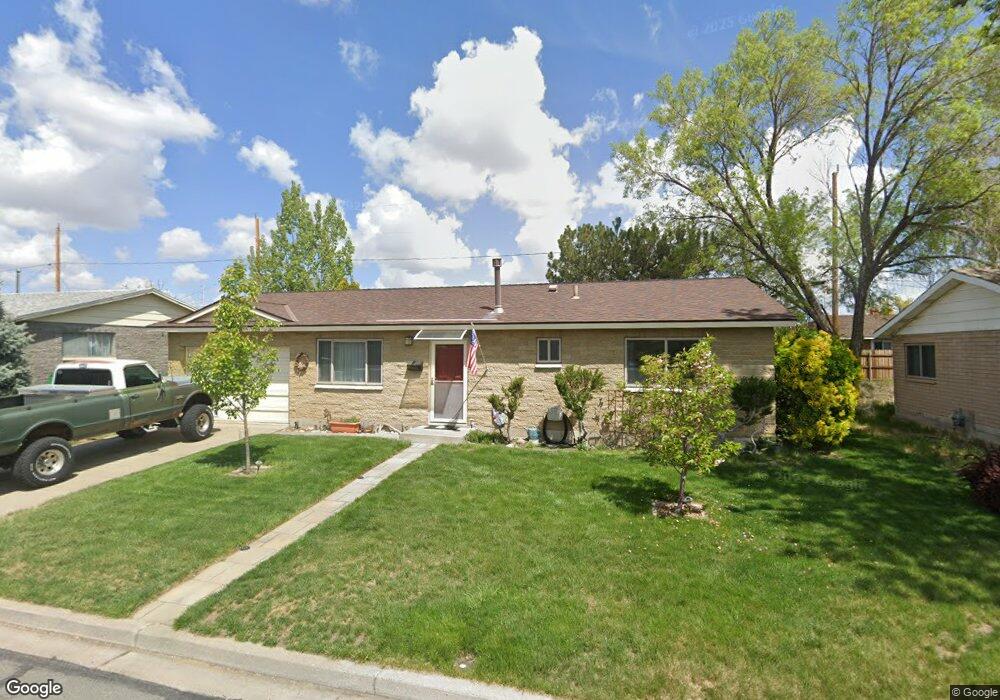
1940 J St Sparks, NV 89431
Downtown Sparks NeighborhoodEstimated Value: $360,000 - $404,000
3
Beds
2
Baths
1,064
Sq Ft
$359/Sq Ft
Est. Value
About This Home
This home is located at 1940 J St, Sparks, NV 89431 and is currently estimated at $382,045, approximately $359 per square foot. 1940 J St is a home located in Washoe County with nearby schools including Kate M Smith Elementary School, Sparks Middle School, and Sparks High School.
Ownership History
Date
Name
Owned For
Owner Type
Purchase Details
Closed on
Aug 21, 2000
Sold by
Depue Carolyn M
Bought by
Murray Richard E and Murray Kathryn A
Current Estimated Value
Home Financials for this Owner
Home Financials are based on the most recent Mortgage that was taken out on this home.
Original Mortgage
$100,800
Outstanding Balance
$35,359
Interest Rate
8.15%
Estimated Equity
$346,687
Create a Home Valuation Report for This Property
The Home Valuation Report is an in-depth analysis detailing your home's value as well as a comparison with similar homes in the area
Home Values in the Area
Average Home Value in this Area
Purchase History
| Date | Buyer | Sale Price | Title Company |
|---|---|---|---|
| Murray Richard E | $112,000 | First Centennial Title Co | |
| Depue Carolyn M | -- | First Centennial Title Co |
Source: Public Records
Mortgage History
| Date | Status | Borrower | Loan Amount |
|---|---|---|---|
| Open | Murray Richard E | $100,800 |
Source: Public Records
Tax History
| Year | Tax Paid | Tax Assessment Tax Assessment Total Assessment is a certain percentage of the fair market value that is determined by local assessors to be the total taxable value of land and additions on the property. | Land | Improvement |
|---|---|---|---|---|
| 2026 | $630 | $53,471 | $35,280 | $18,191 |
| 2024 | $831 | $51,655 | $33,880 | $17,775 |
| 2023 | $809 | $47,741 | $31,325 | $16,416 |
| 2022 | $786 | $41,421 | $27,580 | $13,841 |
| 2021 | $772 | $30,871 | $17,885 | $12,986 |
| 2020 | $749 | $30,406 | $17,430 | $12,976 |
| 2019 | $727 | $28,166 | $15,855 | $12,311 |
| 2018 | $702 | $22,742 | $11,060 | $11,682 |
| 2017 | $684 | $20,929 | $9,345 | $11,584 |
| 2016 | $667 | $20,458 | $8,365 | $12,093 |
| 2015 | $667 | $20,493 | $7,945 | $12,548 |
| 2014 | $644 | $18,589 | $6,230 | $12,359 |
| 2013 | -- | $16,590 | $3,955 | $12,635 |
Source: Public Records
Map
Nearby Homes