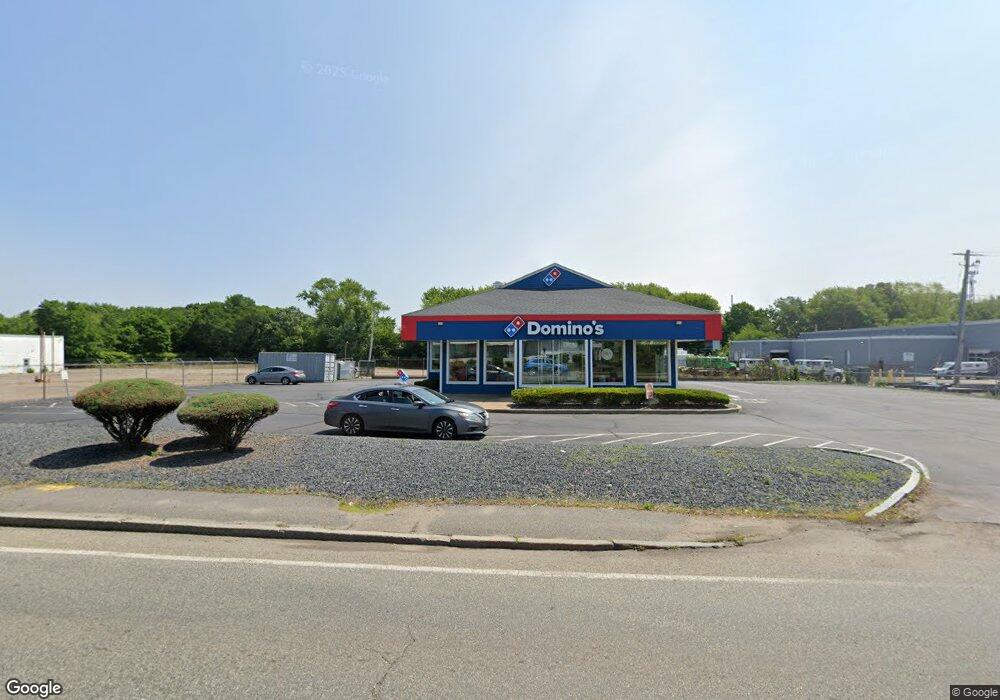
1940 Main St Brockton, MA 02301
Campello NeighborhoodEstimated Value: $758,654
1
Bed
1
Bath
647
Sq Ft
$1,173/Sq Ft
Est. Value
About This Home
This home is located at 1940 Main St, Brockton, MA 02301 and is currently estimated at $758,654, approximately $1,172 per square foot. 1940 Main St is a home located in Plymouth County with nearby schools including Gilmore Elementary School, Davis K-8 School, and John F. Kennedy Elementary School.
Ownership History
Date
Name
Owned For
Owner Type
Purchase Details
Closed on
Jan 13, 2020
Sold by
1940 Main Street Llc
Bought by
Chf Properties Llc
Current Estimated Value
Purchase Details
Closed on
Jul 10, 2015
Sold by
Bri Inc
Bought by
1940 Main Street Llc
Home Financials for this Owner
Home Financials are based on the most recent Mortgage that was taken out on this home.
Original Mortgage
$243,750
Interest Rate
3.87%
Mortgage Type
Commercial
Create a Home Valuation Report for This Property
The Home Valuation Report is an in-depth analysis detailing your home's value as well as a comparison with similar homes in the area
Home Values in the Area
Average Home Value in this Area
Purchase History
| Date | Buyer | Sale Price | Title Company |
|---|---|---|---|
| Chf Properties Llc | $475,000 | None Available | |
| 1940 Main Street Llc | $325,000 | -- |
Source: Public Records
Mortgage History
| Date | Status | Borrower | Loan Amount |
|---|---|---|---|
| Previous Owner | 1940 Main Street Llc | $243,750 |
Source: Public Records
Tax History Compared to Growth
Tax History
| Year | Tax Paid | Tax Assessment Tax Assessment Total Assessment is a certain percentage of the fair market value that is determined by local assessors to be the total taxable value of land and additions on the property. | Land | Improvement |
|---|---|---|---|---|
| 2025 | $17,448 | $721,000 | $272,100 | $448,900 |
| 2024 | $17,340 | $721,000 | $247,400 | $473,600 |
| 2023 | $17,056 | $655,500 | $214,600 | $440,900 |
| 2022 | $16,843 | $597,700 | $214,600 | $383,100 |
| 2021 | $16,821 | $567,500 | $204,400 | $363,100 |
| 2020 | $17,258 | $567,500 | $194,700 | $372,800 |
| 2019 | $17,108 | $540,200 | $194,700 | $345,500 |
| 2018 | $16,977 | $527,500 | $194,700 | $332,800 |
| 2017 | $16,977 | $515,400 | $194,700 | $320,700 |
| 2016 | $16,061 | $501,600 | $194,700 | $306,900 |
| 2015 | -- | $501,600 | $194,700 | $306,900 |
| 2014 | $17,034 | $501,600 | $194,700 | $306,900 |
Source: Public Records
Map
Nearby Homes
- 1933 Main St
- 2000 Main St
- 2020 Main St
- 1854 Main St
- 1829 Main St
- 1824 Main St
- 22 Hayward Ave
- 26 Hayward Ave
- 125 Southland Terrace
- 119 Southland Terrace
- 2074 Main St
- 113 Southland Terrace
- 133 Southland Terrace
- 105 Southland Terrace
- 56 Hayward Ave
- 97 Southland Terrace
- 66 Hayward Ave
- 140 Southland Terrace
- 19 Hayward Ave
- 89 Southland Terrace