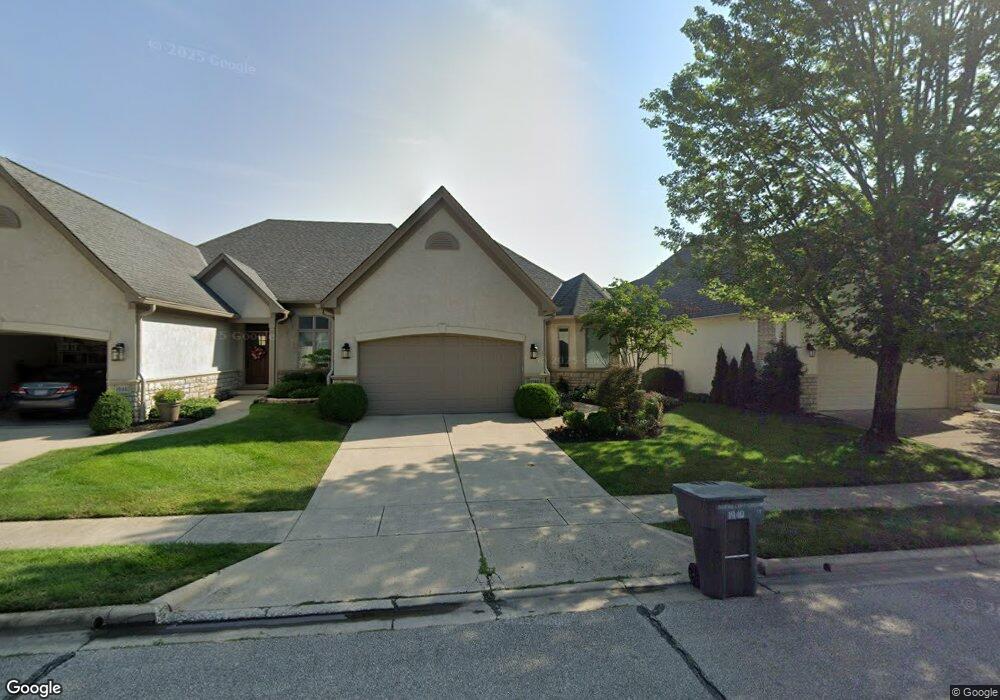
1940 Marblecliff Crossing Ct Columbus, OH 43204
Marble Cliff Crossing NeighborhoodEstimated Value: $613,762 - $821,000
3
Beds
3
Baths
2,930
Sq Ft
$250/Sq Ft
Est. Value
About This Home
This home is located at 1940 Marblecliff Crossing Ct, Columbus, OH 43204 and is currently estimated at $731,941, approximately $249 per square foot. 1940 Marblecliff Crossing Ct is a home located in Franklin County with nearby schools including Valleyview Elementary School, Westmoor Middle School, and West High School.
Ownership History
Date
Name
Owned For
Owner Type
Purchase Details
Closed on
Sep 15, 2004
Sold by
Edwards Sherri C
Bought by
Neroni Timothy G
Current Estimated Value
Purchase Details
Closed on
Aug 7, 2001
Sold by
Morrone Okeefe Development Co Ltd
Bought by
Edwards Sherri C
Create a Home Valuation Report for This Property
The Home Valuation Report is an in-depth analysis detailing your home's value as well as a comparison with similar homes in the area
Home Values in the Area
Average Home Value in this Area
Purchase History
| Date | Buyer | Sale Price | Title Company |
|---|---|---|---|
| Neroni Timothy G | $382,000 | Title First | |
| Edwards Sherri C | $330,000 | Midland Celtic Title |
Source: Public Records
Tax History Compared to Growth
Tax History
| Year | Tax Paid | Tax Assessment Tax Assessment Total Assessment is a certain percentage of the fair market value that is determined by local assessors to be the total taxable value of land and additions on the property. | Land | Improvement |
|---|---|---|---|---|
| 2024 | $7,717 | $171,960 | $43,120 | $128,840 |
| 2023 | $7,619 | $171,960 | $43,120 | $128,840 |
| 2022 | $8,470 | $163,310 | $33,880 | $129,430 |
| 2021 | $8,485 | $163,310 | $33,880 | $129,430 |
| 2020 | $8,496 | $163,310 | $33,880 | $129,430 |
| 2019 | $8,255 | $136,080 | $28,210 | $107,870 |
| 2018 | $6,903 | $136,080 | $28,210 | $107,870 |
| 2017 | $7,646 | $136,080 | $28,210 | $107,870 |
| 2016 | $7,042 | $106,300 | $26,150 | $80,150 |
| 2015 | $6,392 | $106,300 | $26,150 | $80,150 |
| 2014 | $6,408 | $106,300 | $26,150 | $80,150 |
| 2013 | $3,327 | $111,895 | $27,510 | $84,385 |
Source: Public Records
Map
Nearby Homes
- 2754 Scioto Station Dr
- 2170 Lane Woods Dr Unit 2170
- 2704 Scioto Station Dr Unit 2704
- 2842 Gunnison Dr Unit 402
- 2842 Gunnison Dr Unit 403
- 2842 Gunnison Dr Unit 203
- 2248 Quarry Trails Dr
- 2250 Quarry Trails Dr
- 2262 Quarry Trails Dr
- 2879 Kobuk Dr Unit 202
- 2812 Kobuk Dr
- 2832 Kobuk Dr
- 2806 Kobuk Dr
- 2800 Kobuk Dr
- 2792 Kobuk Dr
- 2808 Kobuk Dr
- 2872 Kobuk Dr
- 2867 Kobuk Dr Unit 404
- 2867 Kobuk Dr Unit 304
- 2867 Kobuk Dr Unit 402
- 1946 Marblecliff Crossing Ct
- 1934 Marblecliff Crossing Ct
- 1952 Marblecliff Crossing Ct Unit 42B
- 1928 Marblecliff Crossing Ct
- 1922 Marblecliff Crossing Ct
- 1958 Marblecliff Crossing Ct
- 1916 Marblecliff Crossing Ct
- 1935 Marblecliff Crossing Ct
- 1964 Marblecliff Crossing Ct
- 1929 Marblecliff Crossing Ct
- 1941 Marblecliff Crossing Ct
- 1947 Marblecliff Crossing Ct
- 1910 Marblecliff Crossing Ct
- 1953 Marblecliff Crossing Ct
- 1976 Marblecliff Crossing Ct
- 1965 Marblecliff Crossing Ct
- 1959 Marblecliff Crossing Ct
- 1917 Marblecliff Crossing Ct
- 1923 Marblecliff Crossing Ct
- 1904 Marblecliff Crossing Ct