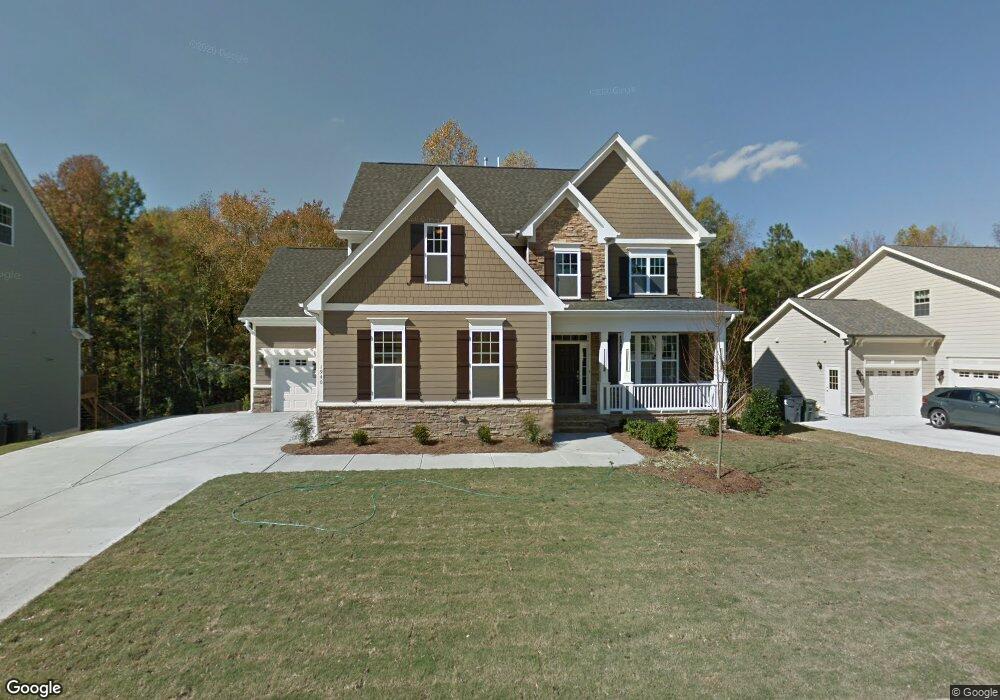
1940 Old Byre Way Apex, NC 27502
Friendship NeighborhoodEstimated Value: $883,000 - $996,000
4
Beds
4
Baths
3,355
Sq Ft
$281/Sq Ft
Est. Value
About This Home
This home is located at 1940 Old Byre Way, Apex, NC 27502 and is currently estimated at $943,760, approximately $281 per square foot. 1940 Old Byre Way is a home located in Wake County with nearby schools including Scotts Ridge Elementary School, Apex Friendship Middle School, and Apex Friendship High School.
Ownership History
Date
Name
Owned For
Owner Type
Purchase Details
Closed on
Jan 18, 2022
Sold by
Tyner Nicole M and Tyner Chadwick D
Bought by
Tyner Trust
Current Estimated Value
Purchase Details
Closed on
Jan 27, 2021
Sold by
Tyner Chadwick D and Tyner Nicole M
Bought by
Tyner Nicole M
Purchase Details
Closed on
Oct 12, 2012
Sold by
Royal Oaks Building Group Llc
Bought by
Tyner Chadwick D and Tyner Nicole M
Home Financials for this Owner
Home Financials are based on the most recent Mortgage that was taken out on this home.
Original Mortgage
$377,558
Interest Rate
3.53%
Mortgage Type
New Conventional
Purchase Details
Closed on
Feb 28, 2012
Sold by
Equity Trust Company
Bought by
Royal Oaks Building Group Llc
Home Financials for this Owner
Home Financials are based on the most recent Mortgage that was taken out on this home.
Original Mortgage
$310,360
Interest Rate
3.89%
Mortgage Type
Construction
Purchase Details
Closed on
Oct 21, 2010
Sold by
Reliabuilt Llc
Bought by
Equity Trust Company
Create a Home Valuation Report for This Property
The Home Valuation Report is an in-depth analysis detailing your home's value as well as a comparison with similar homes in the area
Home Values in the Area
Average Home Value in this Area
Purchase History
| Date | Buyer | Sale Price | Title Company |
|---|---|---|---|
| Tyner Trust | -- | None Listed On Document | |
| Tyner Nicole M | -- | None Available | |
| Tyner Nicole M | -- | None Listed On Document | |
| Tyner Chadwick D | $416,500 | None Available | |
| Royal Oaks Building Group Llc | $76,500 | None Available | |
| Equity Trust Company | -- | None Available | |
| Reliabuilt Llc | $3,524,968 | None Available |
Source: Public Records
Mortgage History
| Date | Status | Borrower | Loan Amount |
|---|---|---|---|
| Previous Owner | Tyner Chadwick D | $377,558 | |
| Previous Owner | Royal Oaks Building Group Llc | $310,360 |
Source: Public Records
Tax History Compared to Growth
Tax History
| Year | Tax Paid | Tax Assessment Tax Assessment Total Assessment is a certain percentage of the fair market value that is determined by local assessors to be the total taxable value of land and additions on the property. | Land | Improvement |
|---|---|---|---|---|
| 2025 | $7,689 | $878,357 | $170,000 | $708,357 |
| 2024 | $7,517 | $878,357 | $170,000 | $708,357 |
| 2023 | $5,774 | $524,511 | $105,000 | $419,511 |
| 2022 | $5,420 | $524,511 | $105,000 | $419,511 |
| 2021 | $5,213 | $524,511 | $105,000 | $419,511 |
| 2020 | $5,160 | $524,511 | $105,000 | $419,511 |
| 2019 | $5,630 | $493,978 | $105,000 | $388,978 |
| 2018 | $5,303 | $493,978 | $105,000 | $388,978 |
| 2017 | $4,935 | $493,978 | $105,000 | $388,978 |
| 2016 | $4,629 | $470,097 | $105,000 | $365,097 |
| 2015 | $4,696 | $465,551 | $78,000 | $387,551 |
| 2014 | -- | $465,551 | $78,000 | $387,551 |
Source: Public Records
Map
Nearby Homes
- 1952 Combine Cir
- 2805 Evans Rd
- 1897 Lazio Ln
- 1956 Lazio Ln
- 2048 Lazio Ln
- 2908 Evans Rd
- 7104 Camp Branch Ln
- 1126 Woodlands Creek Way
- 1124 Woodlands Creek Way
- 2428 Vetrina Way
- 2170 Vittorio Ln
- 2499 Vetrina Way
- 2495 Vetrina Way
- 2511 Vetrina Way
- 2505 Vetrina Way
- 2437 Vetrina Way
- 2429 Vetrina Way
- 2508 Whistling Quail Run
- Elizabeth Plan at Friendship Village - Single-Family
- Dillon Plan at Friendship Village - Single-Family
- 1936 Old Byre Way
- 1944 Old Byre Way
- 1939 Old Byre Way
- 1935 Old Byre Way
- 1948 Old Byre Way
- 1945 Old Byre Way
- 1931 Old Byre Way
- 1952 Old Byre Way
- 1940 Combine Cir
- 1936 Combine Cir
- 1953 Old Byre Way
- 1927 Old Byre Way
- 1944 Combine Cir
- 1932 Combine Cir
- 1956 Old Byre Way
- 1928 Combine Cir
- 1959 Old Byre Way
- 1948 Combine Cir
- 1923 Napoli Dr
- 1919 Napoli Dr