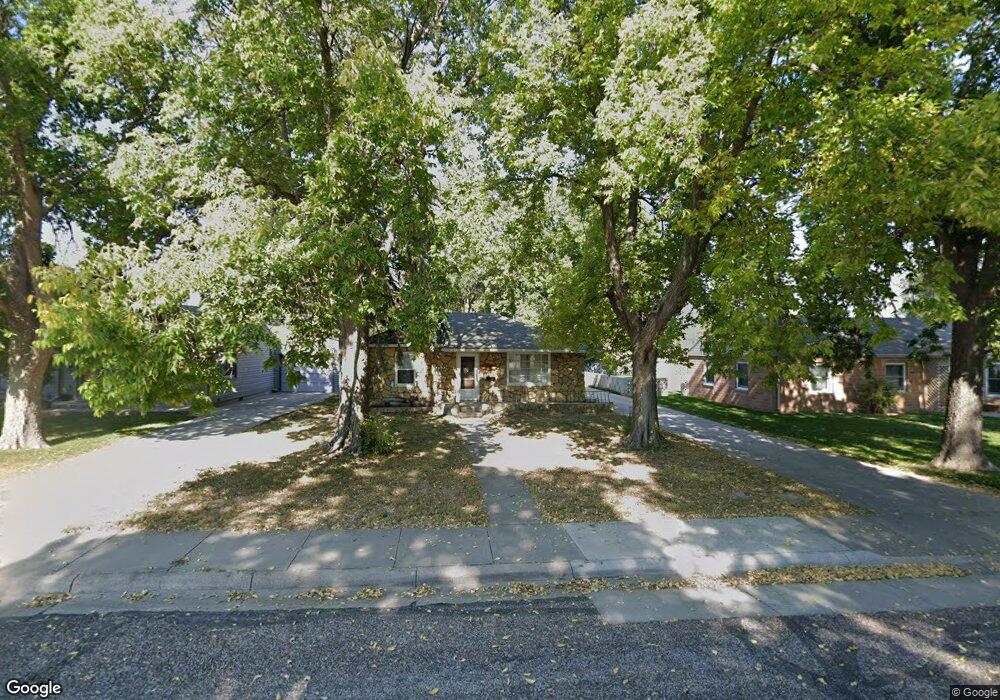
1940 P St Gering, NE 69341
Estimated Value: $138,000 - $175,241
2
Beds
1
Bath
1,176
Sq Ft
$135/Sq Ft
Est. Value
About This Home
This home is located at 1940 P St, Gering, NE 69341 and is currently estimated at $158,560, approximately $134 per square foot. 1940 P St is a home located in Scotts Bluff County with nearby schools including Gering High School and Community Christian Elementary/Middle School.
Ownership History
Date
Name
Owned For
Owner Type
Purchase Details
Closed on
Jul 20, 2011
Sold by
Castillo Andrew J and Castillo Ashley R
Bought by
Cheema Investments Llc
Current Estimated Value
Purchase Details
Closed on
Jul 17, 2006
Sold by
Wickard Vance K and Wickard Karen L
Bought by
Castillo Andrew J and Castillo Ashley R
Home Financials for this Owner
Home Financials are based on the most recent Mortgage that was taken out on this home.
Original Mortgage
$3,000
Interest Rate
6.6%
Mortgage Type
Stand Alone Second
Purchase Details
Closed on
Apr 25, 2005
Sold by
Kraft David
Bought by
Wickard Vance K and Wickard Karen L
Create a Home Valuation Report for This Property
The Home Valuation Report is an in-depth analysis detailing your home's value as well as a comparison with similar homes in the area
Home Values in the Area
Average Home Value in this Area
Purchase History
| Date | Buyer | Sale Price | Title Company |
|---|---|---|---|
| Cheema Investments Llc | $47,229 | -- | |
| Castillo Andrew J | $75,000 | -- | |
| Wickard Vance K | $53,000 | -- |
Source: Public Records
Mortgage History
| Date | Status | Borrower | Loan Amount |
|---|---|---|---|
| Previous Owner | Castillo Andrew J | $3,000 |
Source: Public Records
Tax History
| Year | Tax Paid | Tax Assessment Tax Assessment Total Assessment is a certain percentage of the fair market value that is determined by local assessors to be the total taxable value of land and additions on the property. | Land | Improvement |
|---|---|---|---|---|
| 2025 | $1,281 | $76,155 | $16,250 | $59,905 |
| 2024 | $1,219 | $70,710 | $16,250 | $54,460 |
| 2023 | $1,264 | $59,001 | $8,450 | $50,551 |
| 2022 | $1,264 | $59,001 | $8,450 | $50,551 |
| 2021 | $1,207 | $55,694 | $8,450 | $47,244 |
| 2020 | $1,165 | $53,444 | $8,450 | $44,994 |
| 2019 | $1,150 | $54,094 | $9,100 | $44,994 |
| 2018 | $1,157 | $54,094 | $9,100 | $44,994 |
| 2017 | $1,122 | $52,363 | $9,100 | $43,263 |
| 2016 | $1,041 | $52,363 | $9,100 | $43,263 |
| 2015 | $1,013 | $51,103 | $9,100 | $42,003 |
| 2014 | $965 | $47,992 | $9,100 | $38,892 |
| 2012 | -- | $47,229 | $9,100 | $38,129 |
Source: Public Records
Map
Nearby Homes
Your Personal Tour Guide
Ask me questions while you tour the home.