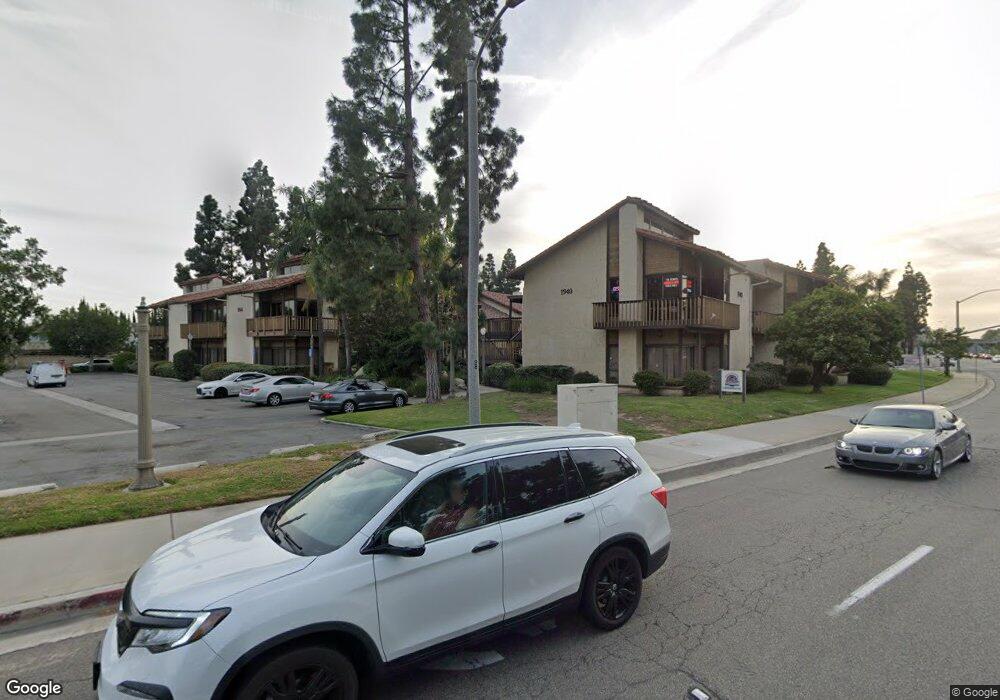
1940 W Orangewood Ave Unit 110-2 Orange, CA 92868
Estimated Value: $9,313,452
--
Bed
--
Bath
36,854
Sq Ft
$253/Sq Ft
Est. Value
About This Home
This home is located at 1940 W Orangewood Ave Unit 110-2, Orange, CA 92868 and is currently estimated at $9,313,452, approximately $252 per square foot. 1940 W Orangewood Ave Unit 110-2 is a home located in Orange County with nearby schools including Sycamore Elementary School, Portola Middle School, and Orange High School.
Ownership History
Date
Name
Owned For
Owner Type
Purchase Details
Closed on
Dec 26, 2021
Sold by
B & G Bozorgi Family Trust
Bought by
Olesus Properties Llc
Current Estimated Value
Home Financials for this Owner
Home Financials are based on the most recent Mortgage that was taken out on this home.
Original Mortgage
$2,600,000
Outstanding Balance
$2,396,224
Interest Rate
3.11%
Mortgage Type
New Conventional
Estimated Equity
$6,917,228
Purchase Details
Closed on
Dec 23, 2019
Sold by
La Linda Llc
Bought by
Bozorgi Bijan and Bozorgi Giti
Purchase Details
Closed on
May 17, 2012
Sold by
Hall Richard L and Hall Shelly L
Bought by
La Linda Llc
Purchase Details
Closed on
May 5, 2003
Sold by
Richard L Hall Enterprises
Bought by
Hall Richard L and Hall Shelly L
Home Financials for this Owner
Home Financials are based on the most recent Mortgage that was taken out on this home.
Original Mortgage
$2,800,000
Interest Rate
5.71%
Mortgage Type
Commercial
Create a Home Valuation Report for This Property
The Home Valuation Report is an in-depth analysis detailing your home's value as well as a comparison with similar homes in the area
Home Values in the Area
Average Home Value in this Area
Purchase History
| Date | Buyer | Sale Price | Title Company |
|---|---|---|---|
| Olesus Properties Llc | $7,500,000 | Ticor Title | |
| Bozorgi Bijan | -- | None Available | |
| La Linda Llc | $2,800,000 | Fidelity National Title | |
| Hall Richard L | -- | Fidelity National Title Co | |
| Richard L Hall Enterprises | -- | Fidelity National Title Co |
Source: Public Records
Mortgage History
| Date | Status | Borrower | Loan Amount |
|---|---|---|---|
| Open | Olesus Properties Llc | $2,600,000 | |
| Previous Owner | Richard L Hall Enterprises | $2,800,000 |
Source: Public Records
Tax History Compared to Growth
Tax History
| Year | Tax Paid | Tax Assessment Tax Assessment Total Assessment is a certain percentage of the fair market value that is determined by local assessors to be the total taxable value of land and additions on the property. | Land | Improvement |
|---|---|---|---|---|
| 2025 | $88,195 | $7,959,060 | $3,926,149 | $4,032,911 |
| 2024 | $88,195 | $7,803,000 | $3,849,165 | $3,953,835 |
| 2023 | $86,234 | $7,650,000 | $3,773,691 | $3,876,309 |
| 2022 | $40,333 | $3,314,106 | $2,130,500 | $1,183,606 |
| 2021 | $39,262 | $3,249,124 | $2,088,725 | $1,160,399 |
| 2020 | $38,893 | $3,215,809 | $2,067,308 | $1,148,501 |
| 2019 | $38,445 | $3,152,754 | $2,026,772 | $1,125,982 |
| 2018 | $37,871 | $3,090,936 | $1,987,032 | $1,103,904 |
| 2017 | $36,393 | $3,030,330 | $1,948,071 | $1,082,259 |
| 2016 | $35,714 | $2,970,912 | $1,909,873 | $1,061,039 |
| 2015 | $35,192 | $2,926,287 | $1,881,185 | $1,045,102 |
| 2014 | $34,449 | $2,868,966 | $1,844,336 | $1,024,630 |
Source: Public Records
Map
Nearby Homes
- 2022 W Spruce Ave
- 2234 W Palm Ave
- 272 N Donneybrooke St
- 148 N Fir St
- 246 N Donneybrooke St
- 526 N Emerald Dr
- 1029 W Sycamore Ave
- 1915 W Almond Ave
- 300 N Rampart St Unit 174
- 300 N Rampart St Unit 194
- 130 N Lester Dr
- 225 S Feldner Rd
- 414 N Clark St Unit D
- 191 N Citrus St
- 262 S La Linda Dr
- 155 S Pepper St
- 185 N Batavia St
- 630 W Palm Ave Unit 15
- 630 W Palm Ave Unit 45
- 630 W Palm Ave Unit 54
- 1940 W Orangewood Ave Unit 202-205 & 207
- 1940 W Orangewood Ave Unit 110-1
- 1940 W Orangewood Ave
- 1940 W Orangewood Ave Unit 104
- 1940 W Orangewood Ave Unit 209
- 1940 W Orangewood Ave Unit 208
- 1940 W Orangewood Ave Unit 201
- 1940 W Orangewood Ave Unit 206
- 1940 W Orangewood Ave Unit 101
- 1940 W Orangewood Ave Unit 103
- 1940 W Orangewood Ave Unit 105-106
- 1940 W Orangewood Ave Unit 110-8
- 1940 W Orangewood Ave Unit 210-212
- 1940 W Orangewood Ave Unit 110- (12,13,15)
- 1940 W Orangewood Ave Unit 110-5
- 1926 W Orangewood Ave Unit 103
- 1914 W Orangewood Ave Unit 201
- 1914 W Orangewood Ave Unit 202
- 1914 W Orangewood Ave
- 1914 W Orangewood Ave Unit B