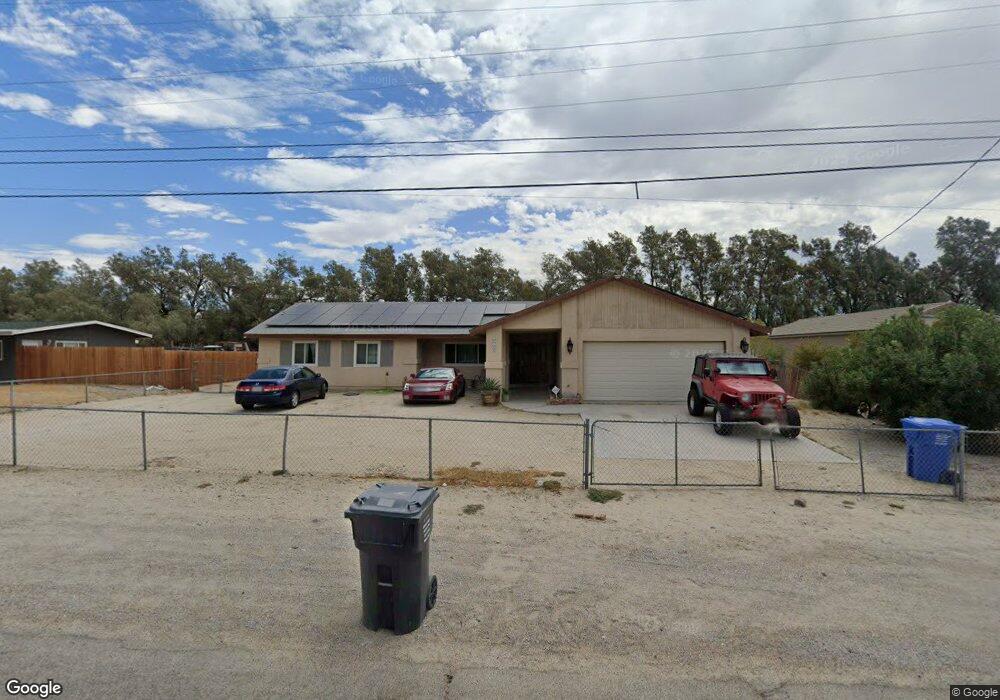
19406 Prickly Pear Trail Desert Hot Springs, CA 92241
Estimated Value: $371,000 - $498,000
3
Beds
2
Baths
1,646
Sq Ft
$266/Sq Ft
Est. Value
About This Home
This home is located at 19406 Prickly Pear Trail, Desert Hot Springs, CA 92241 and is currently estimated at $438,191, approximately $266 per square foot. 19406 Prickly Pear Trail is a home located in Riverside County with nearby schools including Bubbling Wells Elementary School, Desert Springs Middle School, and Desert Hot Springs High School.
Ownership History
Date
Name
Owned For
Owner Type
Purchase Details
Closed on
Sep 28, 2017
Sold by
Moore Edward and Froyd Cherie L
Bought by
Moore Edward and Moore Lisa M
Current Estimated Value
Purchase Details
Closed on
May 2, 2012
Sold by
Ackel James L and Ackel Barbara A
Bought by
Moore Edward and Froyd Cheri L
Purchase Details
Closed on
Aug 1, 2003
Sold by
Ackel James L and Ackel Barbara A
Bought by
Ackel James L and Ackel Barbara A
Home Financials for this Owner
Home Financials are based on the most recent Mortgage that was taken out on this home.
Original Mortgage
$115,200
Interest Rate
5.17%
Mortgage Type
Purchase Money Mortgage
Purchase Details
Closed on
Jan 22, 2003
Sold by
Ackel James L
Bought by
Ackel James L and Ackel Barbara A
Create a Home Valuation Report for This Property
The Home Valuation Report is an in-depth analysis detailing your home's value as well as a comparison with similar homes in the area
Home Values in the Area
Average Home Value in this Area
Purchase History
| Date | Buyer | Sale Price | Title Company |
|---|---|---|---|
| Moore Edward | -- | Accommodation | |
| Moore Edward | $94,000 | Lawyers Title Company | |
| Ackel James L | -- | Security Union Title | |
| Ackel James L | -- | -- |
Source: Public Records
Mortgage History
| Date | Status | Borrower | Loan Amount |
|---|---|---|---|
| Open | Moore Edward | $220,704 | |
| Closed | Moore Edward | $0 | |
| Closed | Moore Edward | $220,000 | |
| Closed | Moore Edward | $142,000 | |
| Closed | Moore Edward | $65,000 | |
| Previous Owner | Ackel James L | $115,200 |
Source: Public Records
Tax History Compared to Growth
Tax History
| Year | Tax Paid | Tax Assessment Tax Assessment Total Assessment is a certain percentage of the fair market value that is determined by local assessors to be the total taxable value of land and additions on the property. | Land | Improvement |
|---|---|---|---|---|
| 2025 | $1,876 | $148,111 | $22,417 | $125,694 |
| 2024 | $1,876 | $145,208 | $21,978 | $123,230 |
| 2023 | $1,888 | $142,362 | $21,548 | $120,814 |
| 2022 | $1,861 | $139,572 | $21,126 | $118,446 |
| 2021 | $1,823 | $136,836 | $20,712 | $116,124 |
| 2020 | $1,727 | $135,434 | $20,500 | $114,934 |
| 2019 | $1,522 | $132,780 | $20,099 | $112,681 |
| 2018 | $1,248 | $103,760 | $15,561 | $88,199 |
| 2017 | $1,226 | $101,726 | $15,256 | $86,470 |
| 2016 | $1,187 | $99,732 | $14,957 | $84,775 |
| 2015 | $1,140 | $98,235 | $14,733 | $83,502 |
| 2014 | $1,130 | $96,313 | $14,446 | $81,867 |
Source: Public Records
Map
Nearby Homes
- 19389 Prickly Pear Trail
- 67590 Hatchet Cactus Dr
- 00 Hatchet Cactus Dr
- 67536 Hatchet Cactus Dr
- 19120 Bubbling Wells Rd
- 67780 Club House Dr
- 67588 Cactus Apple Dr
- 67781 Ocotillo Trail
- 19187 Cottonwood Dr
- 19673 Cottonwood Rd
- 67687 Long Canyon Ln
- 67709 Long Canyon Ln
- 67686 Long Canyon Ln
- 0 Yaqui Ln
- 0 Buckboard Ln Unit 219133310DA
- 67670 Buckboard Ln
- 67645 Broken Arrow Ln
- 67715 Broken Arrow Ln
- 0 Broken Arrow Ln Unit 219132982DA
- 100 El Serape Trail
- 19330 Prickly Pear Trail
- 19486 Prickly Pear Trail
- 0000 Paintbrush Trail
- 19409 Paintbrush Trail
- 19331 Paintbrush Trail
- 19455 Paintbrush Trail
- 19345 Prickly Pear Trail
- 68 Prickly Pear Trail
- 19419 Prickly Pear Trail
- 19329 Prickly Pear Trail
- 19481 Paintbrush Trail
- 19498 Prickly Pear Trail
- 19404 Paintbrush Trail
- 19279 Prickly Pear Trail
- 19310 Paintbrush Trail
- 0 Hatchet Cactus Dr Unit 21317973DA
- 0 Hatchet Cactus Dr Unit 21317816DA
- 0 Hatchet Cactus Dr Unit 21350812DA
- 0 Hatchet Cactus Dr Unit 21402989DA
- 0 Hatchet Cactus Dr Unit 21402988DA