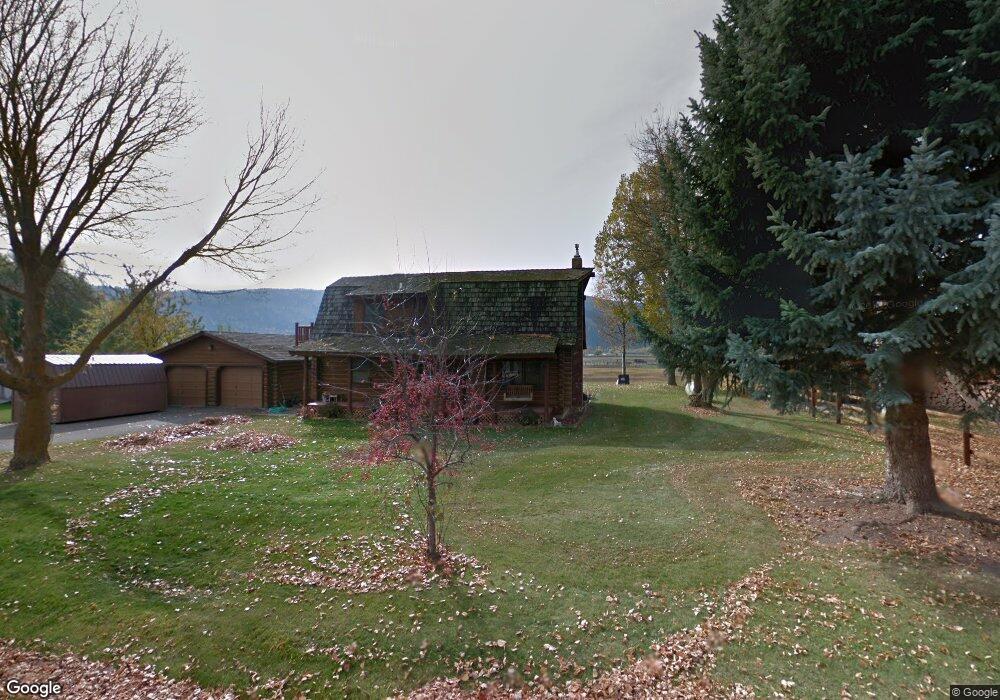
19407 Bryce Putnam Dr Frenchtown, MT 59834
Frenchtown NeighborhoodEstimated Value: $580,000 - $642,000
3
Beds
2
Baths
871
Sq Ft
$695/Sq Ft
Est. Value
About This Home
This home is located at 19407 Bryce Putnam Dr, Frenchtown, MT 59834 and is currently estimated at $605,595, approximately $695 per square foot. 19407 Bryce Putnam Dr is a home located in Missoula County with nearby schools including Frenchtown Elementary School, Frenchtown Intermediate School, and Frenchtown Junior High School.
Ownership History
Date
Name
Owned For
Owner Type
Purchase Details
Closed on
May 25, 2018
Sold by
Clover Marvin
Bought by
Olson Ashley Marie
Current Estimated Value
Home Financials for this Owner
Home Financials are based on the most recent Mortgage that was taken out on this home.
Original Mortgage
$215,000
Outstanding Balance
$185,122
Interest Rate
4.4%
Mortgage Type
New Conventional
Estimated Equity
$420,473
Purchase Details
Closed on
Apr 20, 2007
Sold by
Anderson Herbert E S
Bought by
Clover Marvin
Home Financials for this Owner
Home Financials are based on the most recent Mortgage that was taken out on this home.
Original Mortgage
$90,000
Interest Rate
6.1%
Mortgage Type
Purchase Money Mortgage
Purchase Details
Closed on
Sep 5, 2002
Sold by
Engle David E and Engle Tammy Jo
Bought by
Anderson Herbert E S
Home Financials for this Owner
Home Financials are based on the most recent Mortgage that was taken out on this home.
Original Mortgage
$132,000
Interest Rate
6.29%
Create a Home Valuation Report for This Property
The Home Valuation Report is an in-depth analysis detailing your home's value as well as a comparison with similar homes in the area
Home Values in the Area
Average Home Value in this Area
Purchase History
| Date | Buyer | Sale Price | Title Company |
|---|---|---|---|
| Olson Ashley Marie | -- | Western Title & Escrow | |
| Clover Marvin | -- | First American Title Co | |
| Anderson Herbert E S | -- | Title Services Inc |
Source: Public Records
Mortgage History
| Date | Status | Borrower | Loan Amount |
|---|---|---|---|
| Open | Olson Ashley Marie | $215,000 | |
| Previous Owner | Clover Marvin | $90,000 | |
| Previous Owner | Anderson Herbert E S | $132,000 | |
| Closed | Anderson Herbert E S | $16,500 |
Source: Public Records
Tax History Compared to Growth
Tax History
| Year | Tax Paid | Tax Assessment Tax Assessment Total Assessment is a certain percentage of the fair market value that is determined by local assessors to be the total taxable value of land and additions on the property. | Land | Improvement |
|---|---|---|---|---|
| 2025 | $3,970 | $576,122 | $224,872 | $351,250 |
| 2024 | $4,916 | $477,200 | $90,469 | $386,731 |
| 2023 | $4,000 | $477,200 | $90,469 | $386,731 |
| 2022 | $3,077 | $288,500 | $0 | $0 |
| 2021 | $3,142 | $288,500 | $0 | $0 |
| 2020 | $3,044 | $270,200 | $0 | $0 |
| 2019 | $3,022 | $270,200 | $0 | $0 |
| 2018 | $2,568 | $227,600 | $0 | $0 |
| 2017 | $2,604 | $227,600 | $0 | $0 |
| 2016 | $2,568 | $228,600 | $0 | $0 |
| 2015 | $2,424 | $228,600 | $0 | $0 |
| 2014 | $2,231 | $119,792 | $0 | $0 |
Source: Public Records
Map
Nearby Homes
- 16605 Fox Hill Dr
- NHN Alexander Ln
- 15955 Lemazion Place
- NHN Alexander Rd
- 17503 Pinto Ct
- 21225 Mullan Rd
- 17920 Tonka Ln
- 16350 Pinckney Ct
- 15662 Frenchvalley Ln
- 15315 Westslope Loop
- 0 Nighthawk Dr Unit 24209291
- 000 Buckskin Ln
- 17353 Nighthawk Dr
- 16925 Mullan Rd
- Nhn Clark Fork Bluff
- Nhn Nighthawk Dr
- 19025 Arabian Ln
- 15432 Sara jo Ln
- 19555 Twin Lakes Rd
- 16441 Circle View Dr
- 19433 Bryce Putnam Dr
- 19383 Bryce Putnam Dr
- 15750 Bull Park Ct
- 15755 Bull Park Ct
- 19357 Bryce Putnam Dr
- 19457 Bryce Putnam Dr
- 19483 Bryce Putnam Dr
- 15760 Bull Park Ct
- 15765 Bull Park Ct
- 15855 N Park Dr
- 19507 Bryce Putnam Dr
- 15833 N Park Dr
- 19290 Mullan Rd
- 15830 N Park Dr
- 15725 N Park Dr
- 15778 N Park Dr
- 15804 N Park Dr
- 19250 Mullan Rd
- 19635 Mullan Rd
- 15752 N Park Dr