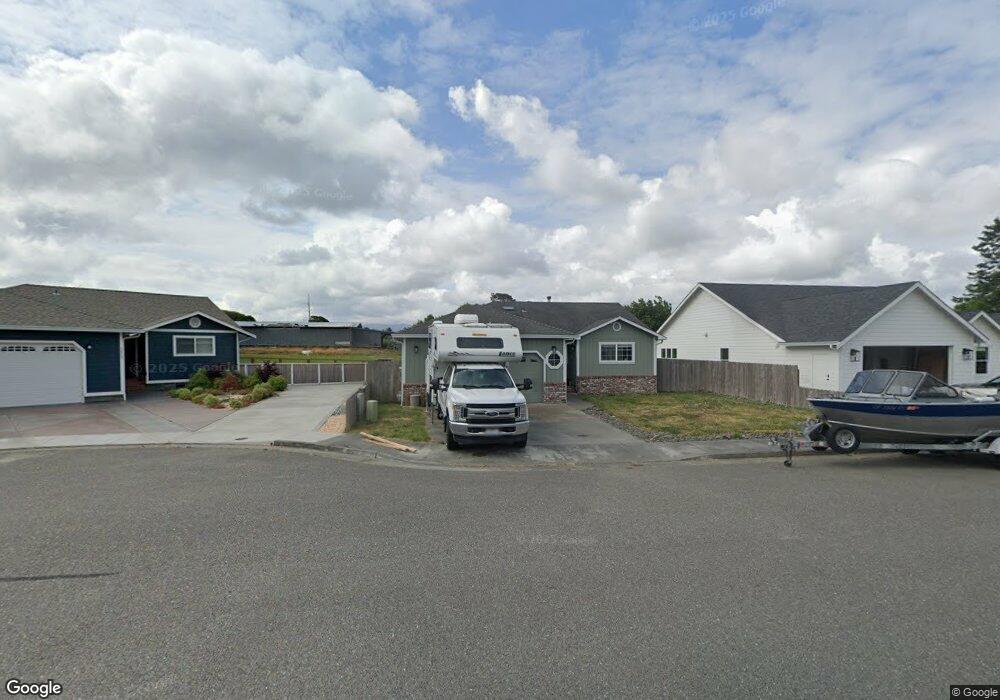
1941 Kelli Way Fortuna, CA 95540
Estimated Value: $428,000 - $485,000
3
Beds
2
Baths
1,475
Sq Ft
$307/Sq Ft
Est. Value
About This Home
This home is located at 1941 Kelli Way, Fortuna, CA 95540 and is currently estimated at $452,783, approximately $306 per square foot. 1941 Kelli Way is a home located in Humboldt County with nearby schools including Fortuna Union High School, East High School, and Redwood Preparatory Charter School.
Ownership History
Date
Name
Owned For
Owner Type
Purchase Details
Closed on
Sep 24, 2009
Sold by
Johnson Mark A and Mark A Johnson Trust Of 2008
Bought by
Rutledge Thaddeus
Current Estimated Value
Home Financials for this Owner
Home Financials are based on the most recent Mortgage that was taken out on this home.
Original Mortgage
$220,000
Outstanding Balance
$142,852
Interest Rate
5.05%
Mortgage Type
New Conventional
Estimated Equity
$309,931
Purchase Details
Closed on
Jun 28, 2000
Sold by
Anderson Forrest C and Anderson Marilyn
Bought by
Johnson Mark A
Home Financials for this Owner
Home Financials are based on the most recent Mortgage that was taken out on this home.
Original Mortgage
$85,000
Interest Rate
8.19%
Purchase Details
Closed on
Jul 9, 1999
Sold by
Petersen Darrel A
Bought by
Anderson Forrest C and Anderson Marilyn
Create a Home Valuation Report for This Property
The Home Valuation Report is an in-depth analysis detailing your home's value as well as a comparison with similar homes in the area
Home Values in the Area
Average Home Value in this Area
Purchase History
| Date | Buyer | Sale Price | Title Company |
|---|---|---|---|
| Rutledge Thaddeus | $275,000 | First American Title Company | |
| Johnson Mark A | $150,000 | First American Title Co | |
| Anderson Forrest C | $36,000 | First American Title |
Source: Public Records
Mortgage History
| Date | Status | Borrower | Loan Amount |
|---|---|---|---|
| Open | Rutledge Thaddeus | $220,000 | |
| Previous Owner | Johnson Mark A | $85,000 |
Source: Public Records
Tax History Compared to Growth
Tax History
| Year | Tax Paid | Tax Assessment Tax Assessment Total Assessment is a certain percentage of the fair market value that is determined by local assessors to be the total taxable value of land and additions on the property. | Land | Improvement |
|---|---|---|---|---|
| 2025 | $3,670 | $354,962 | $116,165 | $238,797 |
| 2024 | $3,670 | $348,003 | $113,888 | $234,115 |
| 2023 | $3,598 | $341,180 | $111,655 | $229,525 |
| 2022 | $3,586 | $334,491 | $109,466 | $225,025 |
| 2021 | $3,532 | $327,933 | $107,320 | $220,613 |
| 2020 | $3,527 | $324,571 | $106,220 | $218,351 |
| 2019 | $3,461 | $318,208 | $104,138 | $214,070 |
| 2018 | $3,414 | $311,970 | $102,097 | $209,873 |
| 2017 | $3,252 | $305,854 | $100,096 | $205,758 |
| 2016 | $3,170 | $299,858 | $98,134 | $201,724 |
| 2015 | $3,066 | $295,354 | $96,660 | $198,694 |
| 2014 | $2,985 | $289,569 | $94,767 | $194,802 |
Source: Public Records
Map
Nearby Homes
- 1545 Xavier Ct
- 1274 Ross Hill Rd
- 3251 Matthew Ln
- 2550 W School St
- 3310 School St
- 1545 Kings Row
- 2208 Royal Dr
- 1598 Queens Row
- 184 Empire Dr
- 197 Empire Dr
- 1521 Imperial Way
- 185 Empire Dr
- 136 Castle Ct
- 160 Monarch Dr
- 1514 Crest Dr
- 1604 Imperial Way
- 2725 Murray Ct
- 2755 Highland Dr
- 1745 Thelma St
- 4372 Forest Hills Dr
- 1923 Kelli Way
- 1969 Kelli Way
- 1985 Kelli Way
- 1898 Kelli Way
- 1917 Kelli Way
- 1895 Kelli Way
- 1295 Mill Creek Way
- 1880 Kelli Way
- 1897 Mill Creek Way
- 1997 Kelli Way
- 1879 Kelli Way
- 1873 Mill Creek Way
- 1868 Kelli Way
- 1853 Kelli Way
- 1851 Mill Creek Way
- 1290 Mill Creek Way
- 1280 Mill Creek Way
- 2849 Kenmar Rd
- 1270 Mill Creek Way
- 1260 Mill Creek Way