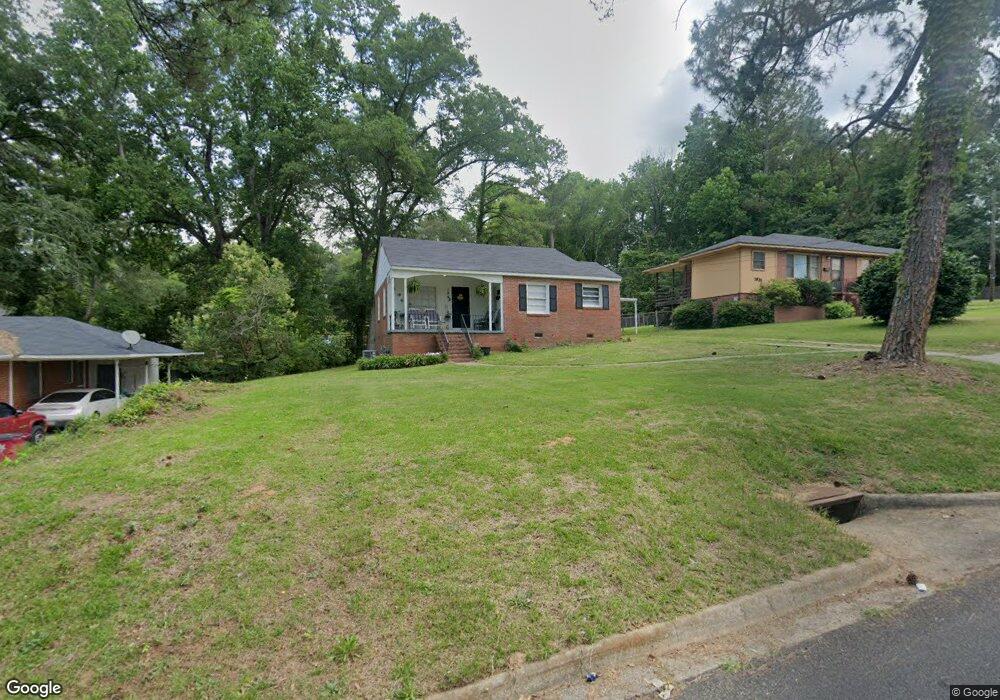
1941 Knightsbridge Rd Macon, GA 31211
Estimated Value: $83,000 - $136,000
3
Beds
1
Bath
1,072
Sq Ft
$105/Sq Ft
Est. Value
About This Home
This home is located at 1941 Knightsbridge Rd, Macon, GA 31211 and is currently estimated at $112,759, approximately $105 per square foot. 1941 Knightsbridge Rd is a home located in Bibb County with nearby schools including Martin Luther King Jr. Elementary School, Appling Middle School, and Northeast High School.
Ownership History
Date
Name
Owned For
Owner Type
Purchase Details
Closed on
Jul 22, 2022
Sold by
Harley Investment Properties Inc
Bought by
Pinkney Victor D
Current Estimated Value
Purchase Details
Closed on
Jul 21, 2022
Sold by
Pinkney Victor D
Bought by
Sfr3-080 Llc
Purchase Details
Closed on
Dec 8, 2017
Sold by
Harley Investment Properties Inc
Bought by
Pinkney Victor D
Purchase Details
Closed on
Oct 29, 2010
Sold by
Federal Home Loan Mortgage Corporation
Bought by
Harley Jack
Purchase Details
Closed on
Jul 6, 2010
Sold by
Ocwen Loan Servicing Llc
Bought by
Federal Home Loan Mort Corp
Purchase Details
Closed on
May 5, 2004
Bought by
Whitworth G Lamar
Create a Home Valuation Report for This Property
The Home Valuation Report is an in-depth analysis detailing your home's value as well as a comparison with similar homes in the area
Home Values in the Area
Average Home Value in this Area
Purchase History
| Date | Buyer | Sale Price | Title Company |
|---|---|---|---|
| Pinkney Victor D | -- | None Listed On Document | |
| Pinkney Victor D | -- | None Listed On Document | |
| Sfr3-080 Llc | $77,000 | None Listed On Document | |
| Sfr3-080 Llc | $77,000 | None Listed On Document | |
| Pinkney Victor D | $75,000 | None Available | |
| Harley Jack | $17,350 | None Available | |
| Federal Home Loan Mort Corp | $52,400 | -- | |
| Federal Home Loan Mortgage Corp | $52,411 | None Available | |
| Ocwen Loan Servicing Llc | $52,411 | None Available | |
| Whitworth G Lamar | $37,000 | -- |
Source: Public Records
Tax History Compared to Growth
Tax History
| Year | Tax Paid | Tax Assessment Tax Assessment Total Assessment is a certain percentage of the fair market value that is determined by local assessors to be the total taxable value of land and additions on the property. | Land | Improvement |
|---|---|---|---|---|
| 2025 | $1,367 | $55,629 | $4,160 | $51,469 |
| 2024 | $1,326 | $52,218 | $2,600 | $49,618 |
| 2023 | $647 | $25,472 | $1,560 | $23,912 |
| 2022 | $589 | $16,999 | $2,588 | $14,411 |
| 2021 | $486 | $12,790 | $1,650 | $11,140 |
| 2020 | $446 | $11,493 | $1,650 | $9,843 |
| 2019 | $450 | $11,493 | $1,650 | $9,843 |
| 2018 | $869 | $11,493 | $1,650 | $9,843 |
| 2017 | $431 | $11,493 | $1,650 | $9,843 |
| 2016 | $398 | $11,493 | $1,650 | $9,843 |
| 2015 | $547 | $11,164 | $1,650 | $9,514 |
| 2014 | $224 | $11,944 | $2,400 | $9,544 |
Source: Public Records
Map
Nearby Homes
- 2458 Tredway Dr
- 2371 Kensington Rd
- 2630 Pauladale Dr
- 2761 Walnut Creek Rd
- 2557 Hyde Park Rd
- 2146 Melton Ave
- 2229 New Clinton Rd
- 2792 Skyline Dr
- 2130 New Clinton Rd
- 2066 Melton Ave
- 837 Artic Cir
- 1840 Kinder Kare Dr
- 1818 Kinder Kare Dr
- 875 Artic Cir
- 875 Artic Place
- 2815 New Clinton Rd
- 2029 Kitchens Rd
- 1008 Sunnydale Dr
- 4436 Jeffersonville Rd
- 1030 Forsyth Ave
- 1949 Knightsbridge Rd
- 1931 Knightsbridge Rd
- 1938 Bayswater Rd
- 1957 Knightsbridge Rd
- 1946 Bayswater Rd
- 1938 Knightsbridge Rd
- 1946 Knightsbridge Rd
- 1930 Knightsbridge Rd
- 1954 Bayswater Rd
- 1965 Knightsbridge Rd
- 1954 Knightsbridge Rd
- 1922 Knightsbridge Rd
- 1962 Baywater Rd
- 1962 Bayswater Rd
- 1981 Knightsbridge Rd
- 1970 Knightsbridge Rd Unit 213
- 1970 Knightsbridge Rd
- 1945 Bayswater Rd
- 1955 Bayswater Rd
- 1970 Bayswater Rd