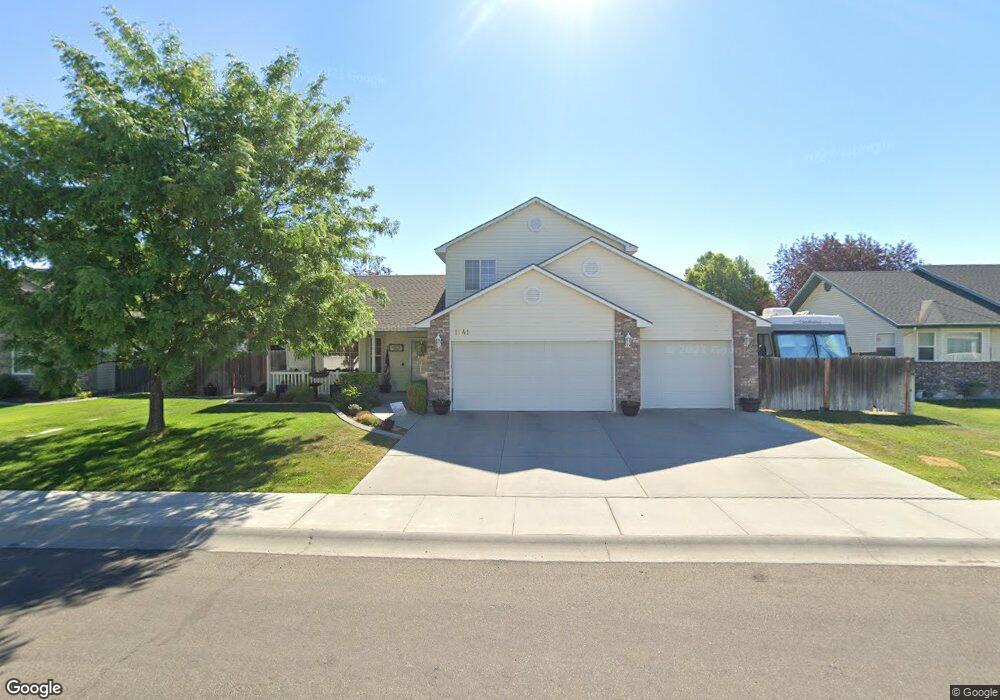
1941 Tamarack Loop Twin Falls, ID 83301
Estimated Value: $430,383 - $450,000
3
Beds
3
Baths
1,708
Sq Ft
$257/Sq Ft
Est. Value
About This Home
This home is located at 1941 Tamarack Loop, Twin Falls, ID 83301 and is currently estimated at $438,596, approximately $256 per square foot. 1941 Tamarack Loop is a home located in Twin Falls County with nearby schools including Sawtooth Elementary School, Vera C. O'Leary Middle School, and Twin Falls Senior High School.
Ownership History
Date
Name
Owned For
Owner Type
Purchase Details
Closed on
Apr 16, 2020
Sold by
Triner Matthew
Bought by
Triner Matthew and Kelley Deb
Current Estimated Value
Home Financials for this Owner
Home Financials are based on the most recent Mortgage that was taken out on this home.
Original Mortgage
$122,000
Outstanding Balance
$84,711
Interest Rate
3.3%
Mortgage Type
New Conventional
Estimated Equity
$353,885
Purchase Details
Closed on
Apr 3, 2009
Sold by
Triner Heidi L
Bought by
Triner Matthew
Home Financials for this Owner
Home Financials are based on the most recent Mortgage that was taken out on this home.
Original Mortgage
$147,700
Interest Rate
5.06%
Mortgage Type
New Conventional
Purchase Details
Closed on
Mar 17, 2005
Sold by
Jermunson Jeff A and Jermunson Rushany
Bought by
Triner Matthew and Triner Heidi L
Home Financials for this Owner
Home Financials are based on the most recent Mortgage that was taken out on this home.
Original Mortgage
$133,200
Interest Rate
5.6%
Mortgage Type
New Conventional
Create a Home Valuation Report for This Property
The Home Valuation Report is an in-depth analysis detailing your home's value as well as a comparison with similar homes in the area
Purchase History
| Date | Buyer | Sale Price | Title Company |
|---|---|---|---|
| Triner Matthew | -- | Titlefact Inc | |
| Triner Matthew | -- | -- | |
| Triner Matthew | -- | -- |
Source: Public Records
Mortgage History
| Date | Status | Borrower | Loan Amount |
|---|---|---|---|
| Open | Triner Matthew | $122,000 | |
| Closed | Triner Matthew | $147,700 | |
| Previous Owner | Triner Matthew | $133,200 |
Source: Public Records
Tax History
| Year | Tax Paid | Tax Assessment Tax Assessment Total Assessment is a certain percentage of the fair market value that is determined by local assessors to be the total taxable value of land and additions on the property. | Land | Improvement |
|---|---|---|---|---|
| 2025 | $2,486 | $385,745 | $83,862 | $301,883 |
| 2024 | $2,499 | $389,618 | $83,862 | $305,756 |
| 2023 | $2,281 | $400,989 | $83,862 | $317,127 |
| 2022 | $2,991 | $386,254 | $69,127 | $317,127 |
| 2021 | $2,730 | $306,305 | $69,127 | $237,178 |
| 2020 | $2,504 | $264,106 | $69,127 | $194,979 |
| 2019 | $2,626 | $247,017 | $59,021 | $187,996 |
| 2018 | $2,383 | $226,151 | $31,955 | $194,196 |
| 2017 | $1,991 | $206,190 | $31,955 | $174,235 |
| 2016 | $1,792 | $178,843 | $0 | $0 |
| 2015 | $1,744 | $178,843 | $31,955 | $146,888 |
| 2012 | -- | $150,678 | $0 | $0 |
Source: Public Records
Map
Nearby Homes
- 1164 Mountain View Dr
- 2024 Julie Ln
- 2028 Candleridge Dr
- 1888 Candleridge Dr
- 1220 Brundage Cir
- 1840 Candleridge Dr
- 1432 Clearwater Way
- 1754 Targhee Dr
- 1368 Stoneybrook Cir
- 2296 Julie Ln
- 1509 Mountain View Dr
- 1442 Stonecrest Ct
- 1605 Targhee Dr
- 1143 Eastridge Way
- 1436 Holly Dr
- 1818 Granada Dr
- 1583 Lagoon Ln
- 2312 Cattail Dr
- 2328 Cattail Dr
- 1697 Tule Dr
- 1937 Tamarack Loop
- 1945 Tamarack Loop
- 2018 Trail Creek Cir
- 2015 Trail Creek Cir
- 1942 Tamarack Loop
- 1928 Tamarack Loop
- 1949 Tamarack Loop
- 1946 Tamarack Loop
- 1929 Tamarack Loop
- 1933 Tamarack Loop
- 2015 Sun Valley Cir
- 1950 Tamarack Loop
- 2026 Trail Creek Cir
- 1953 Tamarack Loop
- 1990 Tamarack Loop
- 2027 Trail Creek Cir
- 1996 Tamarack Loop
- 2018 Candlewood Cir
- 1986 Tamarack Loop
- 2050 Trail Creek Cir
Your Personal Tour Guide
Ask me questions while you tour the home.