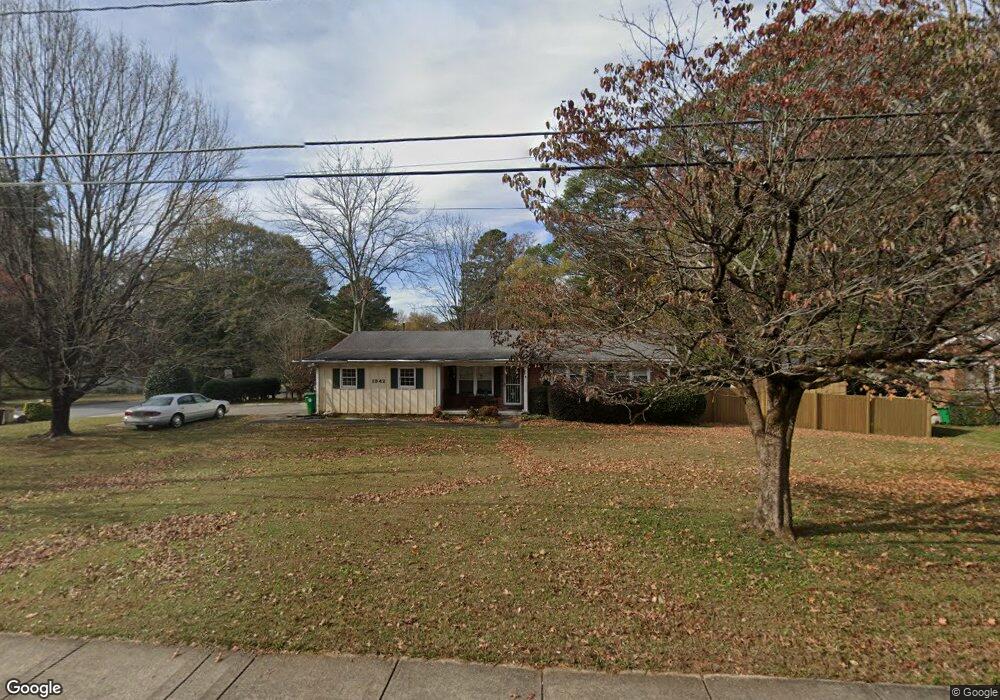
1942 Brockett Rd Tucker, GA 30084
Estimated Value: $316,000 - $388,000
3
Beds
2
Baths
1,362
Sq Ft
$259/Sq Ft
Est. Value
About This Home
This home is located at 1942 Brockett Rd, Tucker, GA 30084 and is currently estimated at $352,999, approximately $259 per square foot. 1942 Brockett Rd is a home located in DeKalb County with nearby schools including Brockett Elementary School, Tucker Middle School, and Tucker High School.
Ownership History
Date
Name
Owned For
Owner Type
Purchase Details
Closed on
Sep 28, 2020
Sold by
Palmer David C
Bought by
Palmer Christine M
Current Estimated Value
Home Financials for this Owner
Home Financials are based on the most recent Mortgage that was taken out on this home.
Original Mortgage
$196,000
Outstanding Balance
$172,697
Interest Rate
2.9%
Mortgage Type
New Conventional
Estimated Equity
$180,302
Purchase Details
Closed on
Nov 27, 2017
Sold by
Beaty Bruce D
Bought by
Palmer David C
Home Financials for this Owner
Home Financials are based on the most recent Mortgage that was taken out on this home.
Original Mortgage
$196,910
Interest Rate
3.94%
Mortgage Type
New Conventional
Purchase Details
Closed on
May 28, 2008
Sold by
Parton Montine R
Bought by
Beaty Bruce D
Home Financials for this Owner
Home Financials are based on the most recent Mortgage that was taken out on this home.
Original Mortgage
$100,800
Interest Rate
5.97%
Mortgage Type
New Conventional
Create a Home Valuation Report for This Property
The Home Valuation Report is an in-depth analysis detailing your home's value as well as a comparison with similar homes in the area
Home Values in the Area
Average Home Value in this Area
Purchase History
| Date | Buyer | Sale Price | Title Company |
|---|---|---|---|
| Palmer Christine M | -- | -- | |
| Palmer David C | $203,000 | -- | |
| Beaty Bruce D | $112,000 | -- |
Source: Public Records
Mortgage History
| Date | Status | Borrower | Loan Amount |
|---|---|---|---|
| Open | Palmer Christine M | $196,000 | |
| Previous Owner | Palmer David C | $196,910 | |
| Previous Owner | Beaty Bruce D | $100,800 |
Source: Public Records
Tax History Compared to Growth
Tax History
| Year | Tax Paid | Tax Assessment Tax Assessment Total Assessment is a certain percentage of the fair market value that is determined by local assessors to be the total taxable value of land and additions on the property. | Land | Improvement |
|---|---|---|---|---|
| 2025 | $3,770 | $133,200 | $32,400 | $100,800 |
| 2024 | $3,613 | $124,120 | $32,400 | $91,720 |
| 2023 | $3,613 | $130,080 | $32,400 | $97,680 |
| 2022 | $3,165 | $108,920 | $18,000 | $90,920 |
| 2021 | $2,785 | $90,960 | $18,000 | $72,960 |
| 2020 | $2,640 | $85,720 | $12,560 | $73,160 |
| 2019 | $2,159 | $65,920 | $12,560 | $53,360 |
| 2018 | $2,598 | $71,000 | $12,560 | $58,440 |
| 2017 | $3,085 | $61,640 | $12,560 | $49,080 |
| 2016 | $3,110 | $62,080 | $12,560 | $49,520 |
| 2014 | $2,706 | $51,640 | $12,560 | $39,080 |
Source: Public Records
Map
Nearby Homes
- 1950 Brockett Rd
- 1889 Carthage Rd
- 1958 Brockett Rd
- 1884 Carthage Rd
- 1964 Brockett Rd Unit 1
- 1901 Carthage Rd
- 1918 Brockett Rd
- 4030 Brockett Creek Dr
- 1898 Carthage Rd Unit 2
- 4027 Woburn Dr Unit 3
- 1911 Carthage Rd
- 4035 Woburn Dr
- 4019 Woburn Dr
- 1912 Brockett Rd
- 4038 Brockett Creek Dr
- 1904 Carthage Rd
- 4013 Woburn Dr Unit 4B
- 4013 Woburn Dr
- 1923 Carthage Rd
- 4033 Brockett Creek Dr