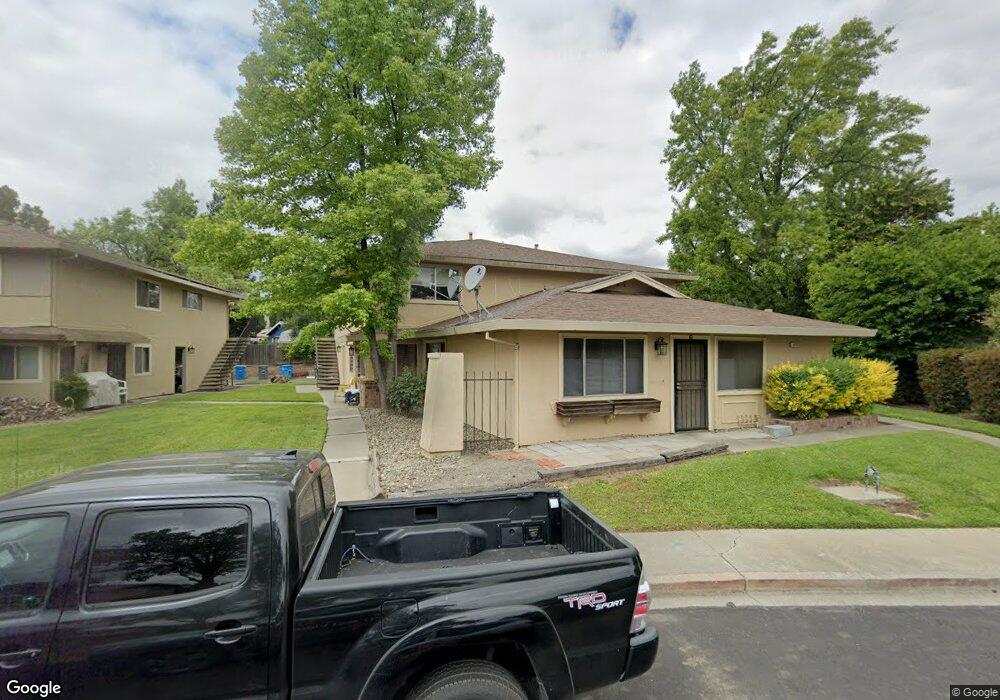
1942 Northwood Dr Unit 1 Vacaville, CA 95687
Estimated Value: $220,000 - $277,000
2
Beds
1
Bath
780
Sq Ft
$318/Sq Ft
Est. Value
About This Home
This home is located at 1942 Northwood Dr Unit 1, Vacaville, CA 95687 and is currently estimated at $248,172, approximately $318 per square foot. 1942 Northwood Dr Unit 1 is a home located in Solano County with nearby schools including Eugene Padan Elementary School, Orchard Elementary School, and Vaca Pena Middle School.
Ownership History
Date
Name
Owned For
Owner Type
Purchase Details
Closed on
Jan 15, 2010
Sold by
Dc Real Estate Fund Ii Lp
Bought by
Tran My Nhan Luu
Current Estimated Value
Purchase Details
Closed on
Sep 23, 2009
Sold by
Fannie Mae
Bought by
Dc Real Estate Fund Ii Lp
Purchase Details
Closed on
Jun 10, 2009
Sold by
Woolums James S and Woolums Kristine L
Bought by
Federal National Mortgage Association
Purchase Details
Closed on
Dec 18, 1995
Sold by
Hud
Bought by
Woolums James S and Woolums Kristine L
Purchase Details
Closed on
Aug 29, 1995
Sold by
North American Mtg Company
Bought by
Hud
Purchase Details
Closed on
Aug 28, 1995
Sold by
Torres Luis E and Nunez Alfonso Torres
Bought by
North American Mtg Company
Purchase Details
Closed on
Mar 25, 1994
Sold by
Torres Luis E and Nunez Alfonso Torres
Bought by
Biedenbender Kathryn Patterson and Biedenbender Donald D
Create a Home Valuation Report for This Property
The Home Valuation Report is an in-depth analysis detailing your home's value as well as a comparison with similar homes in the area
Home Values in the Area
Average Home Value in this Area
Purchase History
| Date | Buyer | Sale Price | Title Company |
|---|---|---|---|
| Tran My Nhan Luu | $60,000 | Placer Title Company | |
| Dc Real Estate Fund Ii Lp | $49,000 | Chicago Title Company | |
| Federal National Mortgage Association | $129,311 | Landsafe Title | |
| Woolums James S | $37,500 | -- | |
| Hud | -- | -- | |
| North American Mtg Company | $84,555 | -- | |
| Biedenbender Kathryn Patterson | -- | -- |
Source: Public Records
Tax History Compared to Growth
Tax History
| Year | Tax Paid | Tax Assessment Tax Assessment Total Assessment is a certain percentage of the fair market value that is determined by local assessors to be the total taxable value of land and additions on the property. | Land | Improvement |
|---|---|---|---|---|
| 2025 | $894 | $77,053 | $19,356 | $57,697 |
| 2024 | $894 | $75,543 | $18,977 | $56,566 |
| 2023 | $871 | $74,062 | $18,605 | $55,457 |
| 2022 | $847 | $72,611 | $18,241 | $54,370 |
| 2021 | $844 | $71,188 | $17,884 | $53,304 |
| 2020 | $831 | $70,459 | $17,701 | $52,758 |
| 2019 | $815 | $69,078 | $17,354 | $51,724 |
| 2018 | $803 | $67,724 | $17,014 | $50,710 |
| 2017 | $775 | $66,397 | $16,681 | $49,716 |
| 2016 | $758 | $65,096 | $16,354 | $48,742 |
| 2015 | $746 | $64,119 | $16,109 | $48,010 |
| 2014 | $700 | $62,864 | $15,794 | $47,070 |
Source: Public Records
Map
Nearby Homes
- 1951 Aletha Ln Unit 4
- 1970 Peabody Rd Unit 1
- 1950 Duxburry Ln Unit 2
- 1930 Duxburry Ln Unit 2
- 1878 Southwood Dr
- 1967 Southwood Dr Unit 2
- 2001 Eastwood Dr Unit 38
- 571 Greenwood Dr
- 500 Gregory Dr
- 137 Valhalla Ct
- 466 Bowline Dr
- 1597 Alamo Dr #141 Dr
- 1597 Alamo Dr Unit 150
- 1597 Alamo Dr Unit 140
- 1597 Alamo Dr Unit 146
- 1597 Alamo Dr Unit 128
- 1597 Alamo Dr Unit 175
- 1607 California Dr
- 424 Beelard Dr
- 165 Audrey Place
- 1942 Northwood Dr
- 1942 Northwood Dr Unit 2
- 1942 Northwood Dr Unit 3
- 1948 Northwood Dr
- 1936 Northwood Dr Unit 4
- 1936 Northwood Dr
- 1936 Northwood Dr Unit 3
- 1936 Northwood Dr Unit 2
- 1936 Northwood Dr Unit 1
- 1960 Forest Ln
- 1954 Northwood Dr
- 1955 Northwood Dr
- 1957 Woodglen Ln Unit 2
- 1957 Woodglen Ln
- 1957 Woodglen Ln
- 1957 Woodglen Ln Unit 1
- 1943 Northwood Dr Unit 3
- 1943 Northwood Dr