1942 Umalu Place Unit 402 Honolulu, HI 96819
Kalihi Valley NeighborhoodEstimated Value: $944,000 - $1,190,000
4
Beds
3
Baths
1,196
Sq Ft
$896/Sq Ft
Est. Value
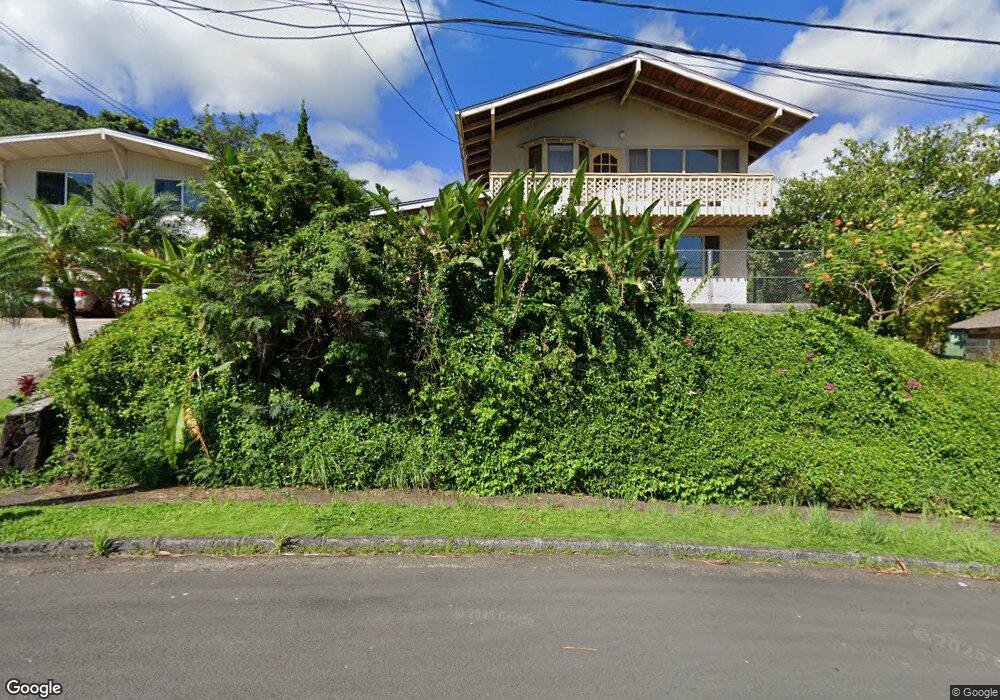
About This Home
This home is located at 1942 Umalu Place Unit 402, Honolulu, HI 96819 and is currently estimated at $1,071,737, approximately $896 per square foot. 1942 Umalu Place Unit 402 is a home located in Honolulu County with nearby schools including Kalihi Elementary School, Governor Sanford B Dole Middle School, and Gov. Wallace Rider Farrington High School.
Ownership History
Date
Name
Owned For
Owner Type
Purchase Details
Closed on
Dec 2, 2020
Sold by
Ige Caryn N and Herbert K Morimatsu Revocable
Bought by
Morimatsu Chanelle K and Estate Of Marc Hitoshi Morimat
Current Estimated Value
Purchase Details
Closed on
Nov 2, 2020
Sold by
Morimatsu Chanelle K and Estate Of Marc Hitoshi Morimat
Bought by
Morimatsu Chanelle Kazue
Purchase Details
Closed on
Oct 6, 2020
Sold by
Ige Caryn N and Herbert K Morimatsu Revocable
Bought by
Morimatsu Jeri Leiko
Purchase Details
Closed on
Jun 22, 1998
Sold by
Morimatsu Herbert Kazuo and Morimatsu Jane Naoko
Bought by
Morimatsu Jane N and Herbert K Morimatsu Revocable Living Tr
Create a Home Valuation Report for This Property
The Home Valuation Report is an in-depth analysis detailing your home's value as well as a comparison with similar homes in the area
Home Values in the Area
Average Home Value in this Area
Purchase History
| Date | Buyer | Sale Price | Title Company |
|---|---|---|---|
| Morimatsu Chanelle K | -- | None Available | |
| Morimatsu Chanelle K | -- | None Available | |
| Morimatsu Chanelle Kazue | -- | None Available | |
| Morimatsu Chanelle Kazue | -- | None Available | |
| Morimatsu Chanelle Kazue | -- | None Available | |
| Morimatsu Chanelle Kazue | -- | None Available | |
| Morimatsu Jeri Leiko | -- | None Available | |
| Morimatsu Jeri Leiko | -- | None Available | |
| Morimatsu Jane N | -- | -- |
Source: Public Records
Tax History Compared to Growth
Tax History
| Year | Tax Paid | Tax Assessment Tax Assessment Total Assessment is a certain percentage of the fair market value that is determined by local assessors to be the total taxable value of land and additions on the property. | Land | Improvement |
|---|---|---|---|---|
| 2025 | $3,211 | $1,085,700 | $772,000 | $313,700 |
| 2024 | $3,211 | $1,037,400 | $772,000 | $265,400 |
| 2023 | $2,907 | $1,030,700 | $814,900 | $215,800 |
| 2022 | $3,402 | $972,000 | $686,300 | $285,700 |
| 2021 | $3,172 | $906,400 | $621,900 | $284,500 |
| 2020 | $3,337 | $953,300 | $643,400 | $309,900 |
| 2019 | $2,847 | $933,400 | $600,500 | $332,900 |
| 2018 | $2,724 | $898,400 | $600,500 | $297,900 |
| 2017 | $2,407 | $807,600 | $557,600 | $250,000 |
| 2016 | $2,415 | $810,100 | $557,600 | $252,500 |
| 2015 | $1,948 | $676,700 | $471,800 | $204,900 |
| 2014 | $2,173 | $707,700 | $471,800 | $235,900 |
Source: Public Records
Map
Nearby Homes
- 1625 Kalaepaa Dr
- 3058 Uaawa Place
- 3043 Numana Rd
- 2930 Laelae Way
- 2871 Kalihi St Unit H
- 2840C Kalihi St
- 2757 Piliwai St
- 1829 Akone Place
- 1835 Akone Place
- 2704 Kalihi St
- 1565 Noe St
- 1565 Moani St
- 1605 Merkle St
- 1581 Murphy St
- 2871-F Kalihi St
- 1561 Ahihi St
- 171 Waokanaka Place Unit 2
- 2202 Wilson St
- 3800 Waokanaka St
- 1709 Perry St
- 3396 Kalihi St
- 1950 Umalu Place
- 1930 Umalu Place
- 1939 Umalu Place
- 1949 Umalu Place
- 1958 Umalu Place
- 1929 Umalu Place
- 1959 Umalu Place
- 3378 Kalihi St
- 1962 Umalu Place
- 1915 Umalu Place
- 1916 Umalu Place
- 1966 Umalu Place
- 3384 Kalihi St
- 1965 Umalu Place
- 3358 Kalihi St
- 3390 Kalihi St Unit A
- 3390 Kalihi St
- 3398 Kalihi St Unit A
- 3398 Kalihi St