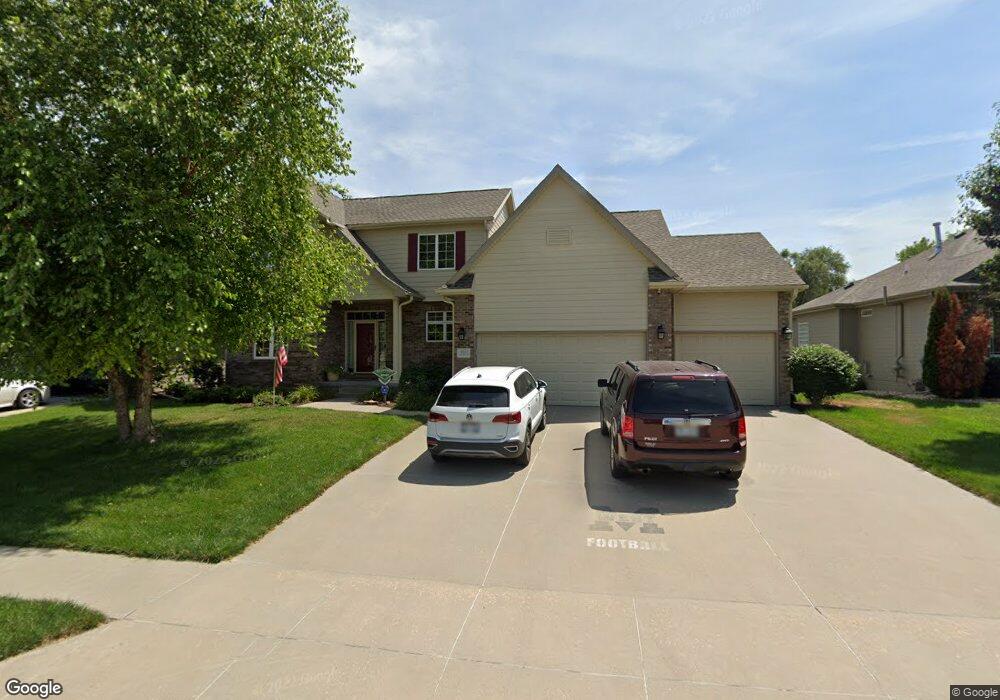
19423 Audrey St Gretna, NE 68028
Estimated Value: $538,000 - $592,000
5
Beds
4
Baths
3,663
Sq Ft
$153/Sq Ft
Est. Value
About This Home
This home is located at 19423 Audrey St, Gretna, NE 68028 and is currently estimated at $562,045, approximately $153 per square foot. 19423 Audrey St is a home located in Sarpy County with nearby schools including Reeder Elementary School, Beadle Middle School, and Millard West High School.
Ownership History
Date
Name
Owned For
Owner Type
Purchase Details
Closed on
May 26, 2010
Sold by
Stephenson Kelly A and Stephenson Craig A
Bought by
Linder Christopher T and Linder Dawn M
Current Estimated Value
Home Financials for this Owner
Home Financials are based on the most recent Mortgage that was taken out on this home.
Original Mortgage
$249,600
Outstanding Balance
$152,585
Interest Rate
3.25%
Estimated Equity
$409,460
Purchase Details
Closed on
May 25, 2007
Sold by
Deprez Brian and Deprez Nicole
Bought by
Stephenson Kelly A and Stephenson Craig A
Home Financials for this Owner
Home Financials are based on the most recent Mortgage that was taken out on this home.
Original Mortgage
$220,000
Interest Rate
6.17%
Purchase Details
Closed on
Feb 23, 2006
Sold by
Bellbrook Development Llc
Bought by
Deprez Brian and Deprez Nicole
Home Financials for this Owner
Home Financials are based on the most recent Mortgage that was taken out on this home.
Original Mortgage
$252,000
Interest Rate
6.09%
Mortgage Type
Small Business Administration
Create a Home Valuation Report for This Property
The Home Valuation Report is an in-depth analysis detailing your home's value as well as a comparison with similar homes in the area
Home Values in the Area
Average Home Value in this Area
Purchase History
| Date | Buyer | Sale Price | Title Company |
|---|---|---|---|
| Linder Christopher T | $312,000 | Fnt | |
| Stephenson Kelly A | $295,000 | Rels | |
| Deprez Brian | $52,000 | Rels |
Source: Public Records
Mortgage History
| Date | Status | Borrower | Loan Amount |
|---|---|---|---|
| Open | Linder Christopher T | $249,600 | |
| Previous Owner | Stephenson Kelly A | $220,000 | |
| Previous Owner | Deprez Brian | $252,000 |
Source: Public Records
Tax History Compared to Growth
Tax History
| Year | Tax Paid | Tax Assessment Tax Assessment Total Assessment is a certain percentage of the fair market value that is determined by local assessors to be the total taxable value of land and additions on the property. | Land | Improvement |
|---|---|---|---|---|
| 2025 | $7,977 | $491,732 | $88,000 | $403,732 |
| 2024 | $8,526 | $482,569 | $88,000 | $394,569 |
| 2023 | $8,526 | $425,628 | $75,000 | $350,628 |
| 2022 | $8,346 | $386,863 | $70,000 | $316,863 |
| 2021 | $7,882 | $361,356 | $68,500 | $292,856 |
| 2020 | $7,931 | $354,663 | $68,500 | $286,163 |
| 2019 | $7,853 | $350,416 | $68,500 | $281,916 |
| 2018 | $8,631 | $371,387 | $59,000 | $312,387 |
| 2017 | $8,670 | $365,719 | $59,000 | $306,719 |
| 2016 | $8,506 | $356,726 | $57,000 | $299,726 |
| 2015 | $8,614 | $350,606 | $57,000 | $293,606 |
| 2014 | $8,717 | $340,064 | $57,000 | $283,064 |
| 2012 | -- | $330,533 | $53,000 | $277,533 |
Source: Public Records
Map
Nearby Homes
- 19603 Brookside Ln
- 7112 S 193rd St
- 19821 Emiline St
- 10416 S 191st St
- 19654 Chandler St
- 10219 S 191st St
- 4549 S 203rd St
- 4505 S 203rd St
- 4538 S 203rd St
- 4522 S 203rd St
- 19920 Tyler St
- 19836 Adams St
- 19965 Polk St
- 19465 Washington Cir
- 6515 S 199th Ave
- 18921 Lillian St
- 20003 Polk St
- 19969 Monroe St
- 20970 Polk St
- 6702 S 200th Ave
- 19419 Audrey St
- 19427 Audrey St
- 19415 Audrey St
- Lot S 195th St
- 19501 Audrey St
- 19418 Audrey St
- 19414 Audrey St
- 19410 Audrey St
- 19505 Audrey St
- 19411 Audrey St
- 19504 Audrey St
- 19406 Audrey St
- 19410 Josephine St
- 19407 Audrey St
- 19509 Audrey St
- 19508 Audrey St
- 19414 Josephine St
- 6910 S 195th St
- 19417 Brookside Ln
- 19406 Josephine St