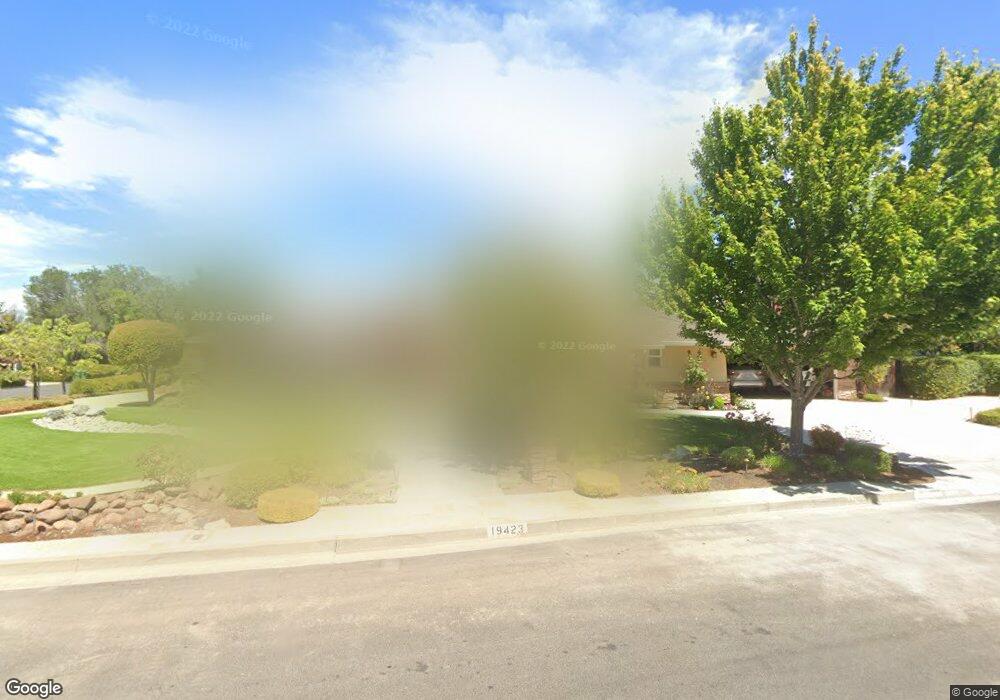
19423 Oahu Ln Saratoga, CA 95070
Portos NeighborhoodEstimated Value: $3,871,000 - $4,370,000
4
Beds
3
Baths
2,529
Sq Ft
$1,621/Sq Ft
Est. Value
About This Home
This home is located at 19423 Oahu Ln, Saratoga, CA 95070 and is currently estimated at $4,099,160, approximately $1,620 per square foot. 19423 Oahu Ln is a home located in Santa Clara County with nearby schools including Argonaut Elementary School, Saratoga Elementary School, and Foothill Elementary School.
Ownership History
Date
Name
Owned For
Owner Type
Purchase Details
Closed on
Sep 26, 2020
Sold by
Snider William F and Snider Linda J
Bought by
Snider William F and Snider Linda J
Current Estimated Value
Home Financials for this Owner
Home Financials are based on the most recent Mortgage that was taken out on this home.
Original Mortgage
$390,000
Interest Rate
2.8%
Mortgage Type
New Conventional
Purchase Details
Closed on
Aug 16, 2011
Sold by
Snider William F and Snider Linda J
Bought by
Snider William F and Snider Linda J
Home Financials for this Owner
Home Financials are based on the most recent Mortgage that was taken out on this home.
Original Mortgage
$729,750
Interest Rate
4.53%
Mortgage Type
New Conventional
Purchase Details
Closed on
Mar 3, 1995
Sold by
Snider William F and Snider Linda J
Bought by
Snider William F and Snider Linda J
Create a Home Valuation Report for This Property
The Home Valuation Report is an in-depth analysis detailing your home's value as well as a comparison with similar homes in the area
Home Values in the Area
Average Home Value in this Area
Purchase History
| Date | Buyer | Sale Price | Title Company |
|---|---|---|---|
| Snider William F | -- | Amrock | |
| Snider William F | -- | Amrock | |
| Snider William F | -- | Accommodation | |
| Snider William F | -- | First American Title Company | |
| Snider William F | -- | -- |
Source: Public Records
Mortgage History
| Date | Status | Borrower | Loan Amount |
|---|---|---|---|
| Closed | Snider William F | $390,000 | |
| Closed | Snider William F | $729,750 |
Source: Public Records
Tax History Compared to Growth
Tax History
| Year | Tax Paid | Tax Assessment Tax Assessment Total Assessment is a certain percentage of the fair market value that is determined by local assessors to be the total taxable value of land and additions on the property. | Land | Improvement |
|---|---|---|---|---|
| 2025 | $7,113 | $535,668 | $130,442 | $405,226 |
| 2024 | $7,113 | $525,166 | $127,885 | $397,281 |
| 2023 | $7,005 | $514,870 | $125,378 | $389,492 |
| 2022 | $6,784 | $504,775 | $122,920 | $381,855 |
| 2021 | $6,653 | $494,878 | $120,510 | $374,368 |
| 2020 | $6,499 | $489,805 | $119,275 | $370,530 |
| 2019 | $6,376 | $480,202 | $116,937 | $363,265 |
| 2018 | $6,250 | $470,788 | $114,645 | $356,143 |
| 2017 | $6,204 | $461,558 | $112,398 | $349,160 |
| 2016 | $5,997 | $452,509 | $110,195 | $342,314 |
| 2015 | $5,856 | $445,713 | $108,540 | $337,173 |
| 2014 | $5,712 | $436,983 | $106,414 | $330,569 |
Source: Public Records
Map
Nearby Homes
- 13550 Myren Dr
- 13446 Alvarado Ct
- 19113 Vineyard Ln
- 19437 Via Real Dr
- 19423 Vineyard Ln
- 19662 Via Grande Dr
- 18732 Afton Ave
- 13010 Glen Brae Dr
- 14001 Chester Ave
- 19938 Baroni Ct
- 11010 Maple Place Unit 25-06 Plan 4
- 10730 Elm Cir Unit 86-17 Plan 2
- 13845 Saratoga Ave
- 10750 Elm Cir Unit 88-17 Plan 2
- 18677 Mccoy Ave
- Plan 2 at The Elms
- Plan 3 at The Elms
- Plan 4 at The Elms
- 11645 Redwood Place Unit 56-12 Plan 4
- 11115 Maple Place Unit 30-07
- 13530 Wendy Ln
- 19171 Oahu Ln
- 13560 Wendy Ln
- 13535 Wendy Ln
- 13514 Wendy Ln
- 19151 Oahu Ln
- 19160 Oahu Ln
- 13519 Wendy Ln
- 13547 Wendy Ln
- 19149 Oahu Ln
- 19148 Oahu Ln
- 13578 Wendy Ln
- 13505 Wendy Ln
- 19180 Portos Dr
- 13557 Wendy Ln
- 19170 Portos Dr
- 19137 Oahu Ln
- 13482 Ronnie Way
- 13494 Ronnie Way
- 13609 Westover Dr