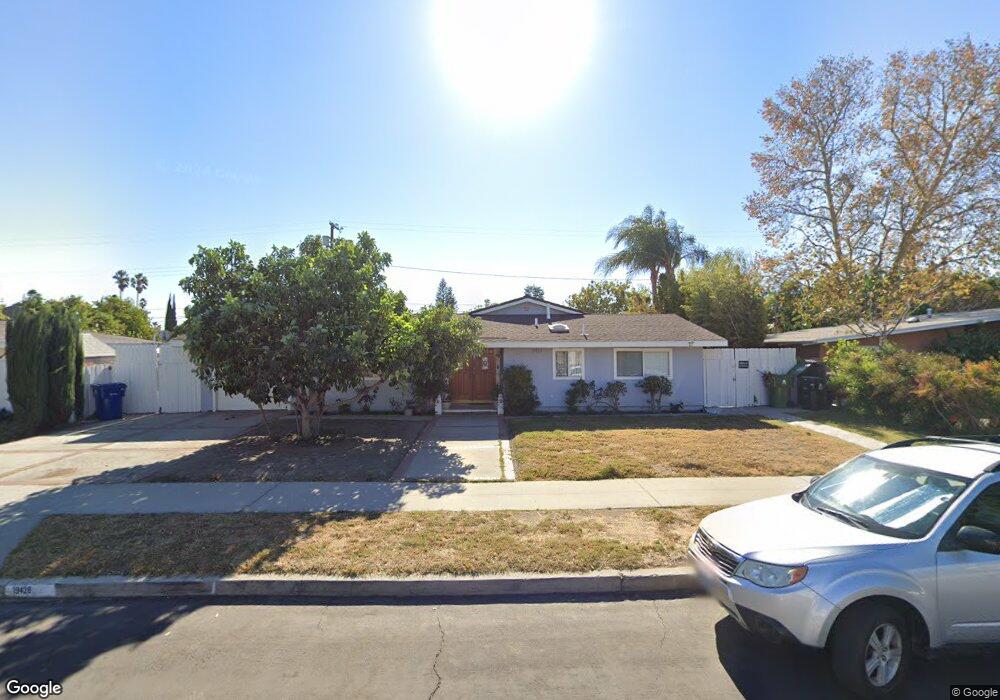
19428 Ingomar St Reseda, CA 91335
Estimated Value: $849,000 - $905,000
3
Beds
3
Baths
1,391
Sq Ft
$626/Sq Ft
Est. Value
About This Home
This home is located at 19428 Ingomar St, Reseda, CA 91335 and is currently estimated at $870,136, approximately $625 per square foot. 19428 Ingomar St is a home located in Los Angeles County with nearby schools including Melvin Avenue Elementary School, John A. Sutter Middle School, and Northridge Academy High.
Ownership History
Date
Name
Owned For
Owner Type
Purchase Details
Closed on
Feb 23, 2020
Sold by
Nguyen Nancy Nguyet and Mai Tony Tu
Bought by
Mai Tony Tu and Gines Phi Mai
Current Estimated Value
Purchase Details
Closed on
Apr 28, 2019
Sold by
Nguyen Nancy Nguyet
Bought by
The Nancy Nguyet Nguyen Living Trust
Create a Home Valuation Report for This Property
The Home Valuation Report is an in-depth analysis detailing your home's value as well as a comparison with similar homes in the area
Home Values in the Area
Average Home Value in this Area
Purchase History
| Date | Buyer | Sale Price | Title Company |
|---|---|---|---|
| Mai Tony Tu | -- | None Available | |
| The Nancy Nguyet Nguyen Living Trust | -- | None Available |
Source: Public Records
Tax History Compared to Growth
Tax History
| Year | Tax Paid | Tax Assessment Tax Assessment Total Assessment is a certain percentage of the fair market value that is determined by local assessors to be the total taxable value of land and additions on the property. | Land | Improvement |
|---|---|---|---|---|
| 2025 | $7,739 | $625,561 | $246,068 | $379,493 |
| 2024 | $7,669 | $613,296 | $241,244 | $372,052 |
| 2023 | $7,523 | $601,271 | $236,514 | $364,757 |
| 2022 | $7,176 | $589,482 | $231,877 | $357,605 |
| 2021 | $7,087 | $577,925 | $227,331 | $350,594 |
| 2020 | $4,012 | $317,017 | $126,803 | $190,214 |
| 2019 | $3,859 | $310,802 | $124,317 | $186,485 |
| 2018 | $3,738 | $304,709 | $121,880 | $182,829 |
| 2016 | $3,560 | $292,880 | $117,149 | $175,731 |
| 2015 | $3,508 | $288,482 | $115,390 | $173,092 |
| 2014 | $3,526 | $282,832 | $113,130 | $169,702 |
Source: Public Records
Map
Nearby Homes
- 19331 Ingomar St
- 19426 Blythe St
- 19516 Blythe St
- 7527 Tampa Ave Unit 1
- 19730 Hatton St
- 19714 Lull St
- 19709 Strathern St
- 19211 Strathern St
- 7428 Bothwell Rd
- 7514 Beckford Ave
- 7430 Corbin Ave Unit 19
- 19803 Covello St
- 19043 Keswick St
- 19844 Hatton St
- 7420 Corbin Ave Unit 12
- 7459 Vanalden Ave
- 7331 1/2 Tampa Ave
- 7414 Quartz Ave
- 19222 Roscoe Blvd
- 7304 Corbin Ave Unit F
- 19422 Ingomar St
- 19436 Ingomar St
- 19437 Stagg St
- 19445 Stagg St
- 19431 Stagg St
- 19414 Ingomar St
- 19444 Ingomar St
- 19431 Ingomar St
- 19425 Ingomar St
- 19453 Stagg St
- 19423 Stagg St
- 19439 Ingomar St
- 19417 Ingomar St
- 19450 Ingomar St
- 19406 Ingomar St
- 19447 Ingomar St
- 19461 Stagg St
- 19415 Stagg St
- 19436 Stagg St
- 19411 Ingomar St