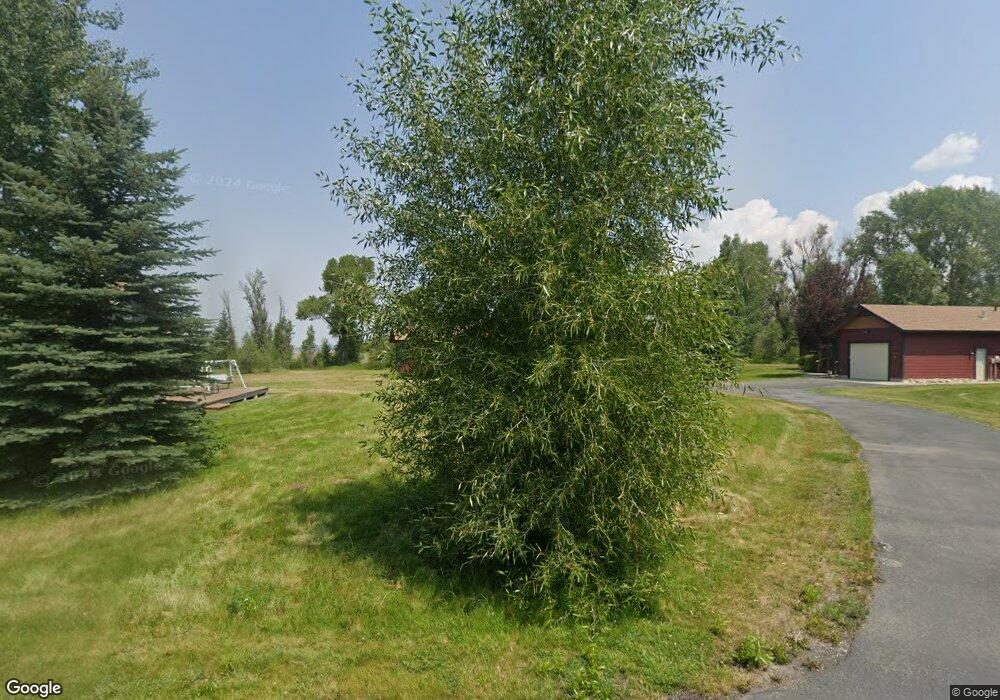
1943 Creek Resort Cir Driggs, ID 83422
Estimated Value: $716,000 - $922,000
2
Beds
3
Baths
1,364
Sq Ft
$600/Sq Ft
Est. Value
About This Home
This home is located at 1943 Creek Resort Cir, Driggs, ID 83422 and is currently estimated at $819,000, approximately $600 per square foot. 1943 Creek Resort Cir is a home with nearby schools including Driggs Elementary School and Teton High School.
Ownership History
Date
Name
Owned For
Owner Type
Purchase Details
Closed on
Jun 27, 2024
Sold by
John E Norton Family Trust and Norton John E
Bought by
John E Norton And Kathleen A Oneil Trust and Norton
Current Estimated Value
Purchase Details
Closed on
Mar 16, 2010
Sold by
Norton John E
Bought by
Norton John E and John E Norton Family Trust
Home Financials for this Owner
Home Financials are based on the most recent Mortgage that was taken out on this home.
Original Mortgage
$168,750
Interest Rate
4.88%
Mortgage Type
New Conventional
Purchase Details
Closed on
Mar 12, 2009
Sold by
Norton John E and Oneil Kathleen A
Bought by
Norton John E and John E Norton Family Trust
Purchase Details
Closed on
May 3, 2006
Sold by
Teton Creek Resort Llc
Bought by
Norton John E and Neil Kathleen A O
Home Financials for this Owner
Home Financials are based on the most recent Mortgage that was taken out on this home.
Original Mortgage
$276,960
Interest Rate
6.29%
Mortgage Type
New Conventional
Create a Home Valuation Report for This Property
The Home Valuation Report is an in-depth analysis detailing your home's value as well as a comparison with similar homes in the area
Home Values in the Area
Average Home Value in this Area
Purchase History
| Date | Buyer | Sale Price | Title Company |
|---|---|---|---|
| John E Norton And Kathleen A Oneil Trust | -- | None Listed On Document | |
| Norton John E | -- | -- | |
| Norton John E | -- | -- | |
| Norton John E | -- | -- |
Source: Public Records
Mortgage History
| Date | Status | Borrower | Loan Amount |
|---|---|---|---|
| Previous Owner | Norton John E | $168,750 | |
| Previous Owner | Norton John E | $276,960 |
Source: Public Records
Tax History Compared to Growth
Tax History
| Year | Tax Paid | Tax Assessment Tax Assessment Total Assessment is a certain percentage of the fair market value that is determined by local assessors to be the total taxable value of land and additions on the property. | Land | Improvement |
|---|---|---|---|---|
| 2025 | $2,557 | $766,993 | $130,000 | $636,993 |
| 2024 | $2,557 | $735,027 | $120,000 | $615,027 |
| 2023 | $2,557 | $735,027 | $120,000 | $615,027 |
| 2022 | $2,651 | $634,928 | $100,000 | $534,928 |
| 2021 | $2,941 | $433,860 | $60,000 | $373,860 |
| 2020 | $2,955 | $356,434 | $50,000 | $306,434 |
| 2019 | $2,642 | $323,601 | $50,000 | $273,601 |
| 2018 | $2,661 | $301,040 | $50,000 | $251,040 |
| 2017 | $2,360 | $294,312 | $50,000 | $244,312 |
| 2016 | $2,020 | $231,449 | $50,000 | $181,449 |
| 2015 | $2,084 | $207,487 | $50,000 | $157,487 |
| 2011 | -- | $202,841 | $52,500 | $150,341 |
Source: Public Records
Map
Nearby Homes
- 2339 Talon Cir
- TBD 10 AC. Stateline Rd
- 80 Alta Meadows Rd
- 1918 Targhee Ridge Dr
- 1830 Mount Davidson Dr
- 1185 Sorensen Way
- 1515 Table Rock Dr
- TBD S Stateline Rd
- 1904 Paintbrush Cir
- 1422 Whitetail Dr
- TBD Wildflower Way
- 1380 S Sorensen Way
- 1313 Whitetail Dr
- 250 N 2000 E
- 500 N 2000 E
- TBD Sagebrush Rd
- 1191 Prairie Dog Way
- 1604 Telemark Trail
- 1745 Crooked Creek Rd
- 2525 N 1000 E
- 1939 Creek Resort Cir
- 1965 Creek Resort Cir
- 1971 Creek Resort Cir Unit ID1310717P
- 1971 Creek Resort Cir Unit 14
- 1929 Creek Resort Cir
- 1975 Creek Resort Cir Unit 15
- 1958 Creek Resort Cir
- 1923 Creek Resort Cir
- 2007 Creek Resort Cir
- 2007 Creek Resort Cir Unit 16
- 2001 Creek Resort Cir Unit 17
- 2001 Creek Resort Cir
- 1996 Creek Resort Cir
- 15 N Stateline Rd
- 1895 Creek Resort Cir
- 1070 Indian Paintbrush Ct
- 1848 Creek Resort Cir
- 1879 Creek Resort Cir
- 2022 Creek Resort Cir Unit ID1310746P
- 2022 Creek Resort Cir