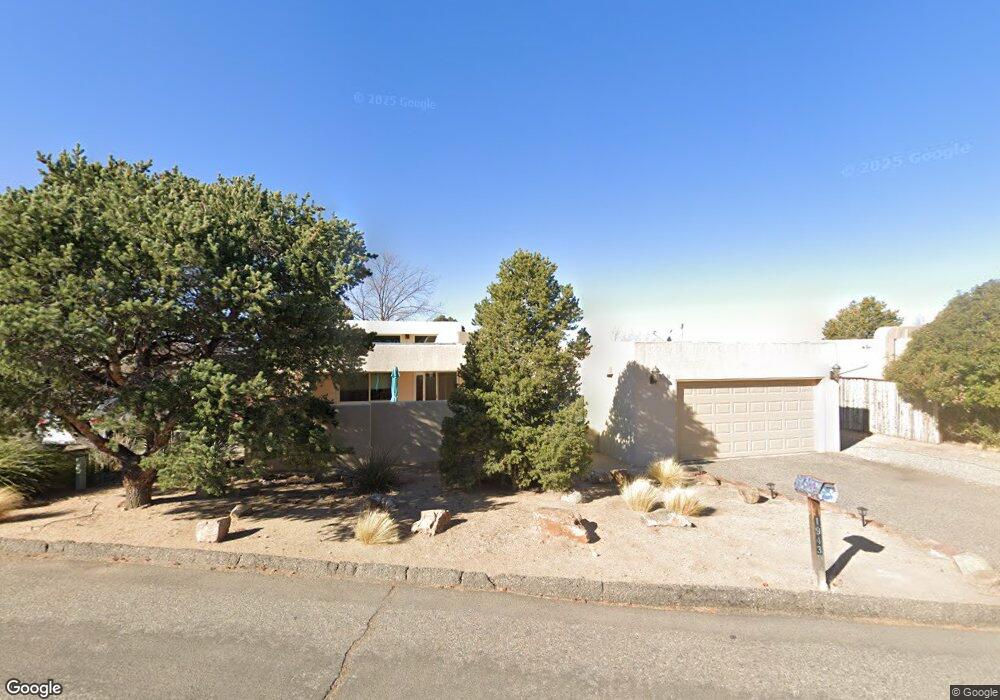
1943 Quail Run Loop NE Albuquerque, NM 87122
Sandia Heights NeighborhoodEstimated Value: $511,000 - $838,254
3
Beds
2
Baths
2,050
Sq Ft
$306/Sq Ft
Est. Value
About This Home
This home is located at 1943 Quail Run Loop NE, Albuquerque, NM 87122 and is currently estimated at $626,814, approximately $305 per square foot. 1943 Quail Run Loop NE is a home located in Bernalillo County with nearby schools including Double Eagle Elementary School, Desert Ridge Middle School, and La Cueva High School.
Ownership History
Date
Name
Owned For
Owner Type
Purchase Details
Closed on
Oct 18, 2011
Sold by
Nale John A and Nale Virginia T
Bought by
Garwood Linda A and Garwood William L
Current Estimated Value
Home Financials for this Owner
Home Financials are based on the most recent Mortgage that was taken out on this home.
Original Mortgage
$195,998
Outstanding Balance
$133,640
Interest Rate
4.17%
Mortgage Type
New Conventional
Estimated Equity
$493,174
Purchase Details
Closed on
May 31, 2005
Sold by
Nale John Adam and Johnson Virginia T
Bought by
Nale John A and Nale Virginia T
Purchase Details
Closed on
Jan 7, 2005
Sold by
Epstein Rosalind G
Bought by
Nale John Adam and Johnson Virginia T
Home Financials for this Owner
Home Financials are based on the most recent Mortgage that was taken out on this home.
Original Mortgage
$231,200
Interest Rate
4.75%
Mortgage Type
Purchase Money Mortgage
Create a Home Valuation Report for This Property
The Home Valuation Report is an in-depth analysis detailing your home's value as well as a comparison with similar homes in the area
Home Values in the Area
Average Home Value in this Area
Purchase History
| Date | Buyer | Sale Price | Title Company |
|---|---|---|---|
| Garwood Linda A | -- | Multiple | |
| Nale John A | -- | -- | |
| Nale John Adam | -- | Fidelity Natl Title Ins Co |
Source: Public Records
Mortgage History
| Date | Status | Borrower | Loan Amount |
|---|---|---|---|
| Open | Garwood Linda A | $195,998 | |
| Previous Owner | Nale John Adam | $231,200 |
Source: Public Records
Tax History Compared to Growth
Tax History
| Year | Tax Paid | Tax Assessment Tax Assessment Total Assessment is a certain percentage of the fair market value that is determined by local assessors to be the total taxable value of land and additions on the property. | Land | Improvement |
|---|---|---|---|---|
| 2025 | $3,220 | $113,020 | $24,795 | $88,225 |
| 2024 | $3,220 | $109,729 | $24,073 | $85,656 |
| 2023 | $3,164 | $106,533 | $23,372 | $83,161 |
| 2022 | $3,052 | $103,430 | $22,691 | $80,739 |
| 2021 | $2,944 | $100,418 | $22,031 | $78,387 |
| 2020 | $2,891 | $97,493 | $21,389 | $76,104 |
| 2019 | $2,801 | $94,654 | $20,766 | $73,888 |
| 2018 | $2,695 | $94,654 | $20,766 | $73,888 |
| 2017 | $2,606 | $91,898 | $20,162 | $71,736 |
| 2016 | $2,518 | $86,624 | $19,005 | $67,619 |
| 2015 | $84,100 | $84,100 | $18,451 | $65,649 |
| 2014 | $2,345 | $81,651 | $17,914 | $63,737 |
| 2013 | -- | $79,274 | $17,393 | $61,881 |
Source: Public Records
Map
Nearby Homes
- 2185 Cattail Willow Ave NE
- 2402 Tramway Terrace Ct NE
- 1861 Tramway Terrace Loop NE
- 975 Antelope Ave NE
- 1239 Rockrose Rd NE
- 1405 San Rafael Place NE
- 12175 Del Rey Ave NE
- 6805 Blanket Flower Place NE
- 1562 Eagle Ridge Ct NE
- 11907 San Rafael Ave NE
- 12110 Palomas Ave NE
- 12709 Sunset Ridge Place NE
- 845 Llave Ln NE
- 348 White Oaks Dr NE
- 450 Live Oak Ln NE
- 12724 Sandia Ridge Place NE
- 6359 Cliffbrush Ln NE
- 13238 Morning Mist Ave NE
- 13415 Quaking Aspen Place NE
- 793 Tramway Ln NE Unit M
- 1945 Quail Run Loop NE
- 1941 Quail Run Loop NE
- 1945 Quail Run Loop NE
- 1936 Quail Run Loop NE
- 1946 Quail Run Loop NE
- 1944 Quail Run Loop NE
- 1947 Quail Run Loop NE
- 1934 Quail Run Loop NE
- 1913 Quail Run Dr NE
- 1949 Quail Run Loop NE
- 1932 Quail Run Loop NE
- 1942 Quail Run Loop NE
- 1924 Quail Run Dr NE
- 1914 Quail Run Dr NE
- 1915 Quail Run Dr NE
- 1922 Quail Run Dr NE
- 1926 Quail Run Dr NE
- 1950 Quail Run Loop NE
- 1940 Quail Run Loop NE
- 1131 Marigold Dr NE