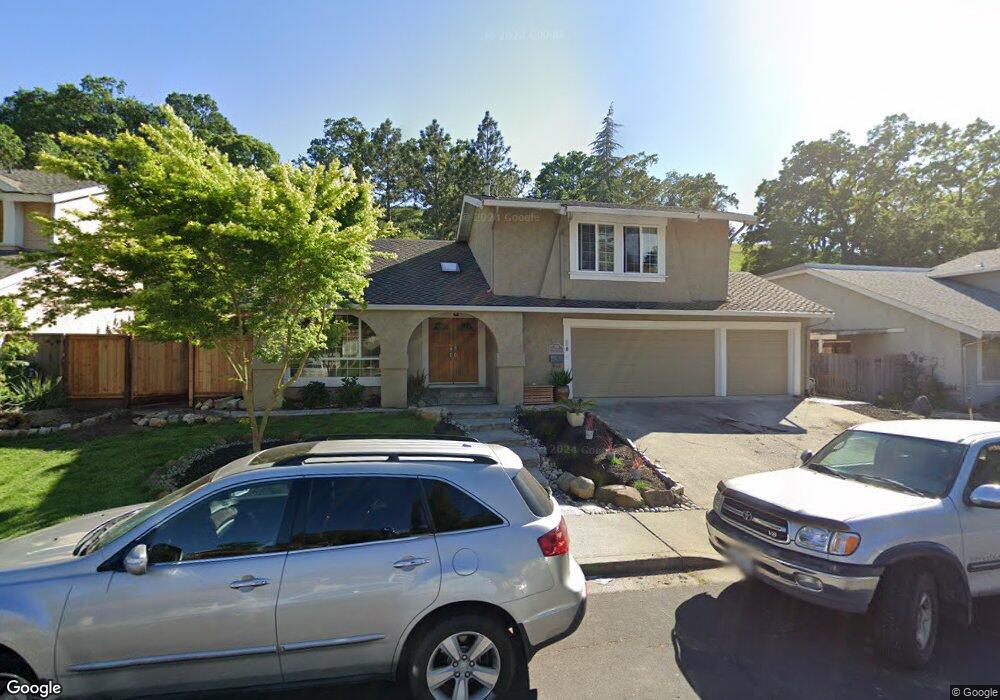
1943 Whitecliff Ct Walnut Creek, CA 94596
Estimated Value: $1,622,000 - $1,772,000
4
Beds
3
Baths
2,092
Sq Ft
$796/Sq Ft
Est. Value
About This Home
This home is located at 1943 Whitecliff Ct, Walnut Creek, CA 94596 and is currently estimated at $1,665,444, approximately $796 per square foot. 1943 Whitecliff Ct is a home located in Contra Costa County with nearby schools including Murwood Elementary School, Walnut Creek Intermediate School, and Las Lomas High School.
Ownership History
Date
Name
Owned For
Owner Type
Purchase Details
Closed on
Jul 30, 2010
Sold by
Franklin Sarah J and Franklin Christopher S
Bought by
Franklin Christopher S
Current Estimated Value
Home Financials for this Owner
Home Financials are based on the most recent Mortgage that was taken out on this home.
Original Mortgage
$589,000
Outstanding Balance
$385,228
Interest Rate
4.33%
Mortgage Type
New Conventional
Estimated Equity
$1,280,216
Purchase Details
Closed on
Oct 21, 2003
Sold by
Lynch Leslie A and Lynch Jennifer G
Bought by
Franklin Christopher S and Franklin Sarah J
Home Financials for this Owner
Home Financials are based on the most recent Mortgage that was taken out on this home.
Original Mortgage
$481,500
Interest Rate
4.75%
Mortgage Type
Purchase Money Mortgage
Create a Home Valuation Report for This Property
The Home Valuation Report is an in-depth analysis detailing your home's value as well as a comparison with similar homes in the area
Home Values in the Area
Average Home Value in this Area
Purchase History
| Date | Buyer | Sale Price | Title Company |
|---|---|---|---|
| Franklin Christopher S | -- | None Available | |
| Franklin Christopher S | $642,000 | Commonwealth Title |
Source: Public Records
Mortgage History
| Date | Status | Borrower | Loan Amount |
|---|---|---|---|
| Open | Franklin Christopher S | $589,000 | |
| Closed | Franklin Christopher S | $481,500 | |
| Closed | Franklin Christopher S | $96,200 |
Source: Public Records
Tax History Compared to Growth
Tax History
| Year | Tax Paid | Tax Assessment Tax Assessment Total Assessment is a certain percentage of the fair market value that is determined by local assessors to be the total taxable value of land and additions on the property. | Land | Improvement |
|---|---|---|---|---|
| 2025 | $11,032 | $912,771 | $597,146 | $315,625 |
| 2024 | $10,771 | $894,875 | $585,438 | $309,437 |
| 2023 | $10,771 | $877,329 | $573,959 | $303,370 |
| 2022 | $10,538 | $860,127 | $562,705 | $297,422 |
| 2021 | $10,254 | $843,263 | $551,672 | $291,591 |
| 2019 | $10,041 | $818,254 | $535,310 | $282,944 |
| 2018 | $9,703 | $802,211 | $524,814 | $277,397 |
| 2017 | $9,524 | $786,482 | $514,524 | $271,958 |
| 2016 | $9,345 | $771,062 | $504,436 | $266,626 |
| 2015 | $9,132 | $759,481 | $496,859 | $262,622 |
| 2014 | $9,026 | $744,605 | $487,127 | $257,478 |
Source: Public Records
Map
Nearby Homes
- 1092 Hillendale Ct
- 716 Rosewood Dr
- 421 Twin Oaks Ln
- 31 Arabian Ct
- 1096 Mountain View Blvd
- 32 Pacer Place
- 2409 Lavender Dr
- 1305 Chesterton Way
- 2129 Youngs Ct
- 628 Sugarloaf Ct
- 172 Rudgear Dr
- 1555 Pebblebrook Ct
- 189 Rudgear Dr
- 2673 Velvet Way
- 1080 Scots Ln
- 2128 San Miguel Dr
- 1101 Scots Ln
- 721 Fair Oaks Dr
- 420 Livorna Rd
- 4 Brookdale Ct
- 1937 Whitecliff Ct
- 1945 Whitecliff Ct
- 1938 Whitecliff Ct
- 1933 Whitecliff Ct
- 1949 Whitecliff Ct
- 1942 Whitecliff Ct
- 1934 Whitecliff Ct
- 1946 Whitecliff Ct
- 1929 Whitecliff Ct
- 1950 Whitecliff Ct
- 1953 Whitecliff Ct
- 1930 Whitecliff Ct
- 2033 Hoover
- 1954 Whitecliff Ct
- 1925 Whitecliff Ct
- 1926 Whitecliff Ct
- 1957 Whitecliff Ct
- 1958 Whitecliff Ct
- 1922 Whitecliff Ct
- 1917 Whitecliff Ct