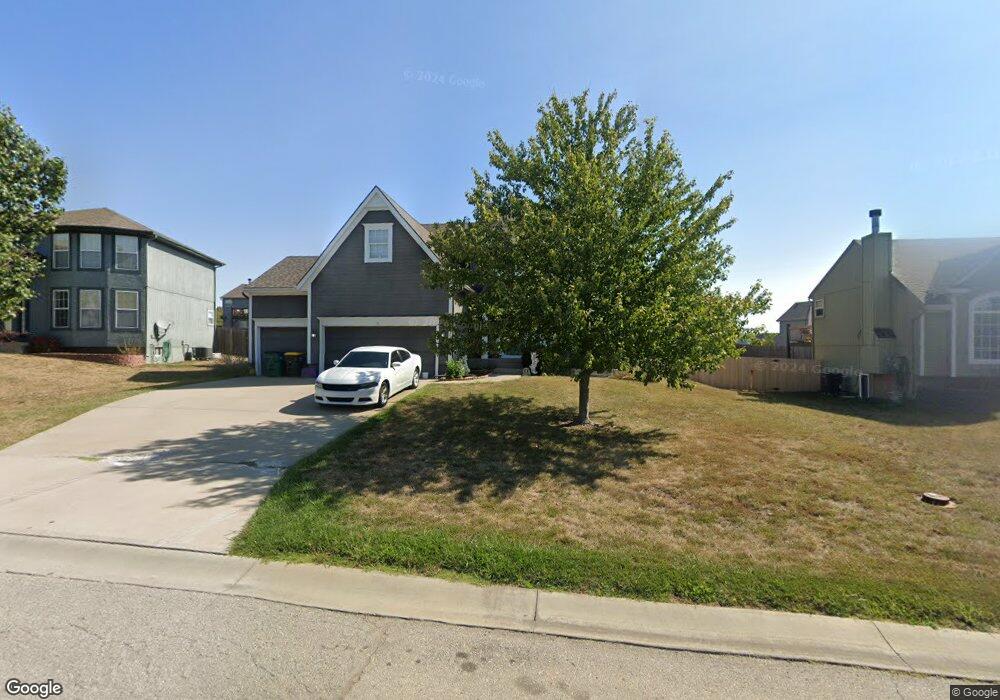
19432 W 209th Terrace Spring Hill, KS 66083
Estimated Value: $418,000 - $445,000
4
Beds
3
Baths
2,096
Sq Ft
$205/Sq Ft
Est. Value
About This Home
This home is located at 19432 W 209th Terrace, Spring Hill, KS 66083 and is currently estimated at $428,991, approximately $204 per square foot. 19432 W 209th Terrace is a home located in Johnson County with nearby schools including Wolf Creek Elementary School, Spring Hill Middle School, and Spring Hill High School.
Ownership History
Date
Name
Owned For
Owner Type
Purchase Details
Closed on
Nov 2, 2012
Sold by
Knox James Joseph
Bought by
Knox Tisha Marie
Current Estimated Value
Purchase Details
Closed on
Sep 30, 2009
Sold by
Campbell Todd A and Campbell Susan J
Bought by
Knox Jim and Knox Tisha
Purchase Details
Closed on
Oct 30, 2006
Sold by
Chris George Homes Inc
Bought by
Campbell Todd A and Campbell Susan J
Home Financials for this Owner
Home Financials are based on the most recent Mortgage that was taken out on this home.
Original Mortgage
$160,000
Interest Rate
6.26%
Mortgage Type
New Conventional
Create a Home Valuation Report for This Property
The Home Valuation Report is an in-depth analysis detailing your home's value as well as a comparison with similar homes in the area
Home Values in the Area
Average Home Value in this Area
Purchase History
| Date | Buyer | Sale Price | Title Company |
|---|---|---|---|
| Knox Tisha Marie | -- | None Available | |
| Knox Jim | -- | Kansas City Title | |
| Campbell Todd A | -- | First American Title |
Source: Public Records
Mortgage History
| Date | Status | Borrower | Loan Amount |
|---|---|---|---|
| Previous Owner | Campbell Todd A | $160,000 |
Source: Public Records
Tax History Compared to Growth
Tax History
| Year | Tax Paid | Tax Assessment Tax Assessment Total Assessment is a certain percentage of the fair market value that is determined by local assessors to be the total taxable value of land and additions on the property. | Land | Improvement |
|---|---|---|---|---|
| 2024 | $6,381 | $45,517 | $9,266 | $36,251 |
| 2023 | $6,018 | $42,757 | $8,418 | $34,339 |
| 2022 | $5,093 | $35,972 | $7,652 | $28,320 |
| 2021 | $5,041 | $34,615 | $6,381 | $28,234 |
| 2020 | $4,772 | $31,671 | $5,804 | $25,867 |
| 2019 | $4,581 | $30,383 | $5,793 | $24,590 |
| 2018 | $4,069 | $27,888 | $5,793 | $22,095 |
| 2017 | $3,971 | $26,945 | $4,828 | $22,117 |
| 2016 | $3,843 | $25,967 | $4,579 | $21,388 |
| 2015 | $3,595 | $24,288 | $4,579 | $19,709 |
| 2013 | -- | $22,896 | $4,579 | $18,317 |
Source: Public Records
Map
Nearby Homes
- 19441 W 208th St
- Yorkshire V Plan at Woodland Ridge
- Ashwood Plan at Woodland Ridge
- Magnolia Plan at Woodland Ridge
- Cypress II Plan at Woodland Ridge
- 37769 W 208th Terrace
- 37733 W 208th Terrace
- 37778 W 208th Terrace
- 37754 W 208th Terrace
- 37841 W 208th Terrace
- 19207 W 205th Terrace
- 19305 W 209th Terrace
- 20729 S Barker Rd
- 20774 Emerald St
- 20814 W 188th St
- 20786 Emerald St
- 20727 Emerald St
- 20714 Emerald St
- 21066 S Skyview Ln
- Allen Plan at Hidden Hills
- 19412 W 209th Terrace
- 19351 W 208th St
- 19349 W 209th St
- 19371 W 208th St
- 19472 W 209th Terrace
- 19402 W 209th Terrace
- 19425 W 209th Terrace
- 19391 W 208th St
- 19339 W 209th St
- 19407 W 209th Terrace
- 19492 W 209th Terrace
- 19390 W 209th Terrace
- 19405 W 208th St
- 19403 W 209th Terrace
- 20909 S Barker Rd
- 19395 W 209th Terrace
- 19380 W 208th St
- 20905 S Barker Rd
- 20913 S Barker Rd
- 20877 S Barker Rd