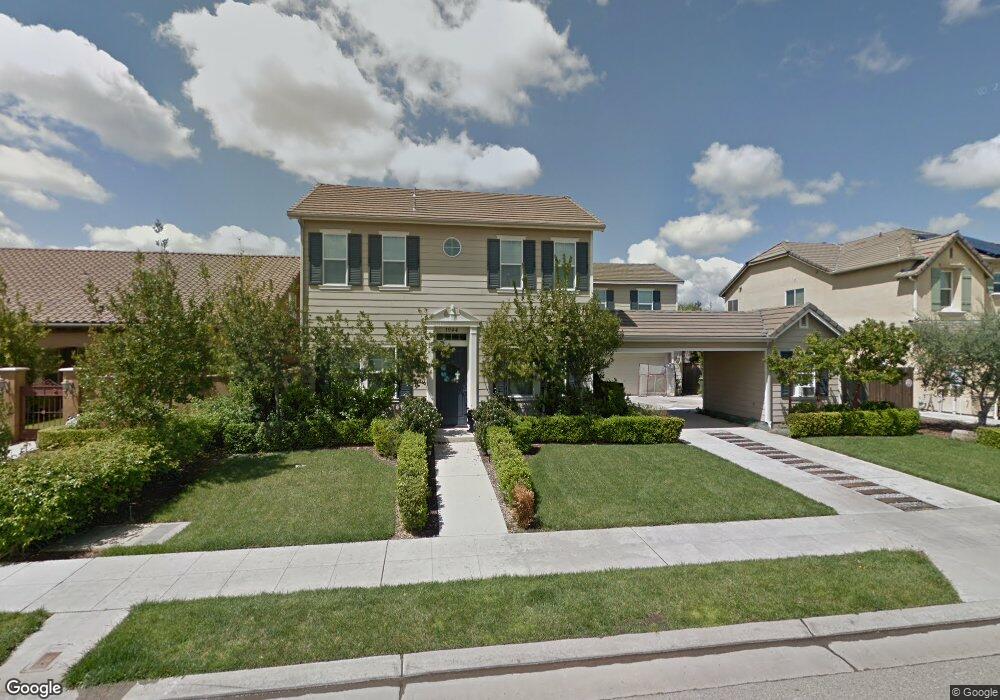
1944 N Pamela Ave Clovis, CA 93619
Estimated Value: $605,000 - $780,000
5
Beds
4
Baths
3,715
Sq Ft
$181/Sq Ft
Est. Value
About This Home
This home is located at 1944 N Pamela Ave, Clovis, CA 93619 and is currently estimated at $670,934, approximately $180 per square foot. 1944 N Pamela Ave is a home located in Fresno County with nearby schools including Bud Rank Elementary School, Granite Ridge Intermediate School, and Clovis North High School.
Ownership History
Date
Name
Owned For
Owner Type
Purchase Details
Closed on
Jan 3, 2024
Sold by
Pruett Thomas Dean and Pruett Desiree Lynn
Bought by
Thomas And Desiree Pruett Living Trust and Pruett
Current Estimated Value
Purchase Details
Closed on
Jan 1, 2024
Sold by
Pruett Thomas Dean and Pruett Desiree Lynn
Bought by
Thomas And Desiree Pruett Living Trust and Pruett
Purchase Details
Closed on
Feb 10, 2009
Sold by
Town & Country At Harlan Ranch Lp
Bought by
Pruett Thomas Dean and Pruett Desiree Lynn
Home Financials for this Owner
Home Financials are based on the most recent Mortgage that was taken out on this home.
Original Mortgage
$424,960
Interest Rate
5.04%
Mortgage Type
VA
Purchase Details
Closed on
Sep 10, 2007
Sold by
Cvec Group Inc
Bought by
Town & Country At Harlan Ranch Lp
Create a Home Valuation Report for This Property
The Home Valuation Report is an in-depth analysis detailing your home's value as well as a comparison with similar homes in the area
Home Values in the Area
Average Home Value in this Area
Purchase History
| Date | Buyer | Sale Price | Title Company |
|---|---|---|---|
| Thomas And Desiree Pruett Living Trust | -- | None Listed On Document | |
| Thomas And Desiree Pruett Living Trust | -- | None Listed On Document | |
| Pruett Thomas Dean | $415,000 | Chicago Title Company | |
| Town & Country At Harlan Ranch Lp | -- | Chicago Title Company |
Source: Public Records
Mortgage History
| Date | Status | Borrower | Loan Amount |
|---|---|---|---|
| Previous Owner | Pruett Thomas Dean | $424,960 |
Source: Public Records
Tax History
| Year | Tax Paid | Tax Assessment Tax Assessment Total Assessment is a certain percentage of the fair market value that is determined by local assessors to be the total taxable value of land and additions on the property. | Land | Improvement |
|---|---|---|---|---|
| 2025 | $6,625 | $534,406 | $148,085 | $386,321 |
| 2023 | $6,378 | $513,657 | $142,336 | $371,321 |
| 2022 | $6,354 | $503,587 | $139,546 | $364,041 |
| 2021 | $5,915 | $473,000 | $176,000 | $297,000 |
| 2020 | $5,438 | $430,000 | $160,000 | $270,000 |
| 2019 | $5,214 | $411,400 | $123,300 | $288,100 |
| 2018 | $5,056 | $399,600 | $119,800 | $279,800 |
| 2017 | $4,795 | $377,100 | $113,100 | $264,000 |
| 2016 | $4,516 | $359,300 | $107,800 | $251,500 |
| 2015 | $4,289 | $340,600 | $102,200 | $238,400 |
| 2014 | $4,037 | $319,000 | $95,700 | $223,300 |
Source: Public Records
Map
Nearby Homes
- 1882 N Nadine Ave
- 3544 Prescott Ave
- 3652 Serena Ave
- 3560 Bloomfield Ln
- 3202 Everglade Ave
- 1609 N Piccadilly Ln
- 3664 Vermont Ln
- The Cali Plan at Deauville East - Traditional Series
- The Everly Plan at Deauville East - Traditional Series
- The Aria Plan at Deauville East - Traditional Series
- The Benton Plan at Deauville East - Traditional Series
- The Pasatiempo Plan at Deauville East - Traditional Series
- The Bella Plan at Deauville East - Traditional Series
- 3396 Trenton Ave
- 1906 N Langley Ave
- 3531 Alcove Way
- 1687 N Blackwood Ave
- 3611 Alcove Way
- 1675 N Blackwood Ave
- 3482 Elevations Way
- 1954 N Pamela Ave
- 1924 N Pamela Ave
- 1914 N Pamela Ave
- 1974 N Pamela Ave
- 1943 N Nadine Ave
- 1953 N Nadine Ave
- 1923 N Nadine Ave
- 1945 N Pamela Ave
- 1925 N Pamela Ave
- 1955 N Pamela Ave
- 1973 N Nadine Ave
- 1913 N Nadine Ave
- 1915 N Pamela Ave
- 1904 N Pamela Ave
- 1975 N Pamela Ave
- 1884 N Pamela Ave
- 1983 N Nadine Ave
- 1893 N Nadine Ave
- 1985 N Pamela Ave
- 3565 Everglade Ave
Your Personal Tour Guide
Ask me questions while you tour the home.