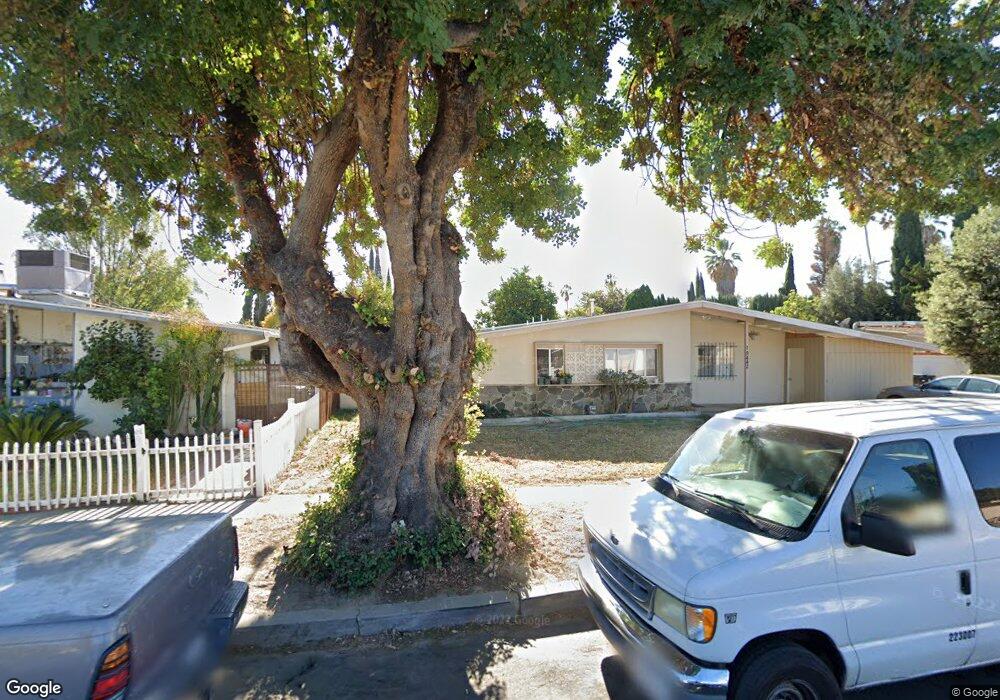
19442 Hemmingway St Reseda, CA 91335
Estimated Value: $843,585 - $921,000
3
Beds
2
Baths
1,554
Sq Ft
$565/Sq Ft
Est. Value
About This Home
This home is located at 19442 Hemmingway St, Reseda, CA 91335 and is currently estimated at $878,396, approximately $565 per square foot. 19442 Hemmingway St is a home located in Los Angeles County with nearby schools including Melvin Avenue Elementary School, John A. Sutter Middle School, and Northridge Academy High.
Ownership History
Date
Name
Owned For
Owner Type
Purchase Details
Closed on
Dec 28, 2017
Sold by
Nguyen Jonas Belinda B
Bought by
Nguyen Jonas Belinda B and Nguyen 2017 Revocable Trust
Current Estimated Value
Purchase Details
Closed on
Feb 13, 2002
Sold by
Nguyen Jonas Belinda B
Bought by
Nguyen Jonas Belinda B
Home Financials for this Owner
Home Financials are based on the most recent Mortgage that was taken out on this home.
Original Mortgage
$185,000
Interest Rate
6.94%
Purchase Details
Closed on
Sep 10, 1999
Sold by
Nguyen Jonas Belinda B
Bought by
Nguyen Jonas Belinda R
Home Financials for this Owner
Home Financials are based on the most recent Mortgage that was taken out on this home.
Original Mortgage
$166,500
Interest Rate
8.09%
Purchase Details
Closed on
Jul 1, 1998
Sold by
Nguyen Anthony K
Bought by
Nguyen Jonas Belinda B
Create a Home Valuation Report for This Property
The Home Valuation Report is an in-depth analysis detailing your home's value as well as a comparison with similar homes in the area
Home Values in the Area
Average Home Value in this Area
Purchase History
| Date | Buyer | Sale Price | Title Company |
|---|---|---|---|
| Nguyen Jonas Belinda B | -- | None Available | |
| Nguyen Jonas Belinda B | -- | American Title Co | |
| Nguyen Jonas Belinda R | -- | Stewart Title | |
| Nguyen Jonas Belinda B | -- | -- |
Source: Public Records
Mortgage History
| Date | Status | Borrower | Loan Amount |
|---|---|---|---|
| Closed | Nguyen Jonas Belinda B | $185,000 | |
| Closed | Nguyen Jonas Belinda R | $166,500 |
Source: Public Records
Tax History Compared to Growth
Tax History
| Year | Tax Paid | Tax Assessment Tax Assessment Total Assessment is a certain percentage of the fair market value that is determined by local assessors to be the total taxable value of land and additions on the property. | Land | Improvement |
|---|---|---|---|---|
| 2025 | $4,992 | $397,966 | $288,828 | $109,138 |
| 2024 | $4,992 | $390,164 | $283,165 | $106,999 |
| 2023 | $4,899 | $382,514 | $277,613 | $104,901 |
| 2022 | $4,676 | $375,015 | $272,170 | $102,845 |
| 2021 | $4,614 | $367,663 | $266,834 | $100,829 |
| 2019 | $4,479 | $356,760 | $258,920 | $97,840 |
| 2018 | $4,370 | $349,766 | $253,844 | $95,922 |
| 2016 | $4,166 | $336,187 | $243,988 | $92,199 |
| 2015 | $4,107 | $331,139 | $240,324 | $90,815 |
| 2014 | $4,128 | $324,654 | $235,617 | $89,037 |
Source: Public Records
Map
Nearby Homes
- 19426 Blythe St
- 19516 Blythe St
- 19331 Ingomar St
- 19211 Strathern St
- 19709 Strathern St
- 19730 Hatton St
- 7527 Tampa Ave Unit 1
- 19714 Lull St
- 19222 Roscoe Blvd
- 19158 Roscoe Blvd
- 19043 Keswick St
- 19106 Cantara St
- 7514 Beckford Ave
- 19844 Hatton St
- 8359 Melvin Ave
- 19803 Covello St
- 7428 Bothwell Rd
- 19144 Schoenborn St
- 7430 Corbin Ave Unit 19
- 19910 Cantara St
- 19434 Hemmingway St
- 19450 Hemmingway St
- 19439 Arminta St
- 19433 Arminta St
- 19447 Arminta St
- 19428 Hemmingway St
- 19458 Hemmingway St
- 19443 Hemmingway St
- 19451 Hemmingway St
- 19435 Hemmingway St
- 19425 Arminta St
- 19455 Arminta St
- 19459 Hemmingway St
- 19429 Hemmingway St
- 19420 Hemmingway St
- 19464 Hemmingway St
- 19463 Arminta St
- 19417 Arminta St
- 19438 Arminta St
- 19432 Blythe St