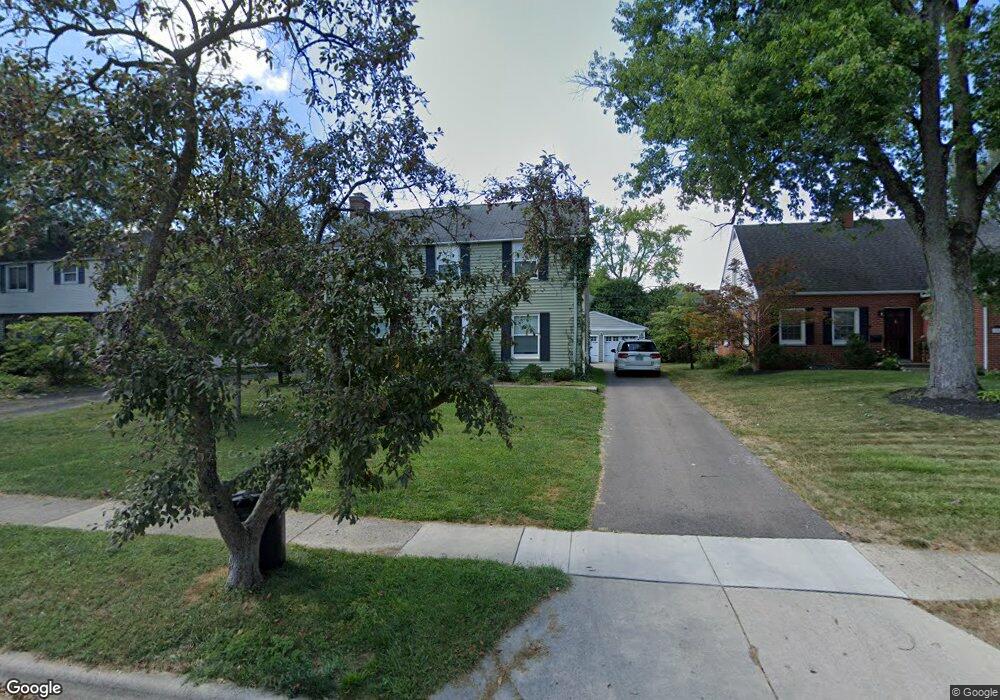
1945 Andover Rd Columbus, OH 43212
Estimated Value: $761,000 - $888,000
4
Beds
2
Baths
2,332
Sq Ft
$352/Sq Ft
Est. Value
About This Home
This home is located at 1945 Andover Rd, Columbus, OH 43212 and is currently estimated at $819,906, approximately $351 per square foot. 1945 Andover Rd is a home located in Franklin County with nearby schools including Barrington Road Elementary School, Jones Middle School, and Upper Arlington High School.
Ownership History
Date
Name
Owned For
Owner Type
Purchase Details
Closed on
Dec 23, 2016
Sold by
Mcceary Catherine C
Bought by
Mccreary Heather P and Mccreary Sean T
Current Estimated Value
Home Financials for this Owner
Home Financials are based on the most recent Mortgage that was taken out on this home.
Original Mortgage
$200,000
Outstanding Balance
$164,225
Interest Rate
4.08%
Mortgage Type
New Conventional
Estimated Equity
$655,681
Purchase Details
Closed on
Dec 21, 2016
Sold by
Mcreary Jack E and Mcreary Catherine C
Bought by
Mcreary Catherine C
Home Financials for this Owner
Home Financials are based on the most recent Mortgage that was taken out on this home.
Original Mortgage
$200,000
Outstanding Balance
$164,225
Interest Rate
4.08%
Mortgage Type
New Conventional
Estimated Equity
$655,681
Purchase Details
Closed on
Dec 29, 1992
Bought by
Mccreary Jack E
Purchase Details
Closed on
Sep 7, 1989
Create a Home Valuation Report for This Property
The Home Valuation Report is an in-depth analysis detailing your home's value as well as a comparison with similar homes in the area
Home Values in the Area
Average Home Value in this Area
Purchase History
| Date | Buyer | Sale Price | Title Company |
|---|---|---|---|
| Mccreary Heather P | $200,000 | Great American Title | |
| Mcreary Catherine C | -- | Great American Title | |
| Mccreary Jack E | -- | -- | |
| -- | -- | -- |
Source: Public Records
Mortgage History
| Date | Status | Borrower | Loan Amount |
|---|---|---|---|
| Open | Mccreary Heather P | $200,000 |
Source: Public Records
Tax History Compared to Growth
Tax History
| Year | Tax Paid | Tax Assessment Tax Assessment Total Assessment is a certain percentage of the fair market value that is determined by local assessors to be the total taxable value of land and additions on the property. | Land | Improvement |
|---|---|---|---|---|
| 2024 | $14,624 | $252,600 | $126,320 | $126,280 |
| 2023 | $14,442 | $252,595 | $126,315 | $126,280 |
| 2022 | $11,517 | $164,820 | $71,440 | $93,380 |
| 2021 | $10,195 | $164,820 | $71,440 | $93,380 |
| 2020 | $10,105 | $164,820 | $71,440 | $93,380 |
| 2019 | $10,194 | $147,010 | $71,440 | $75,570 |
| 2018 | $9,239 | $147,010 | $71,440 | $75,570 |
| 2017 | $9,213 | $147,010 | $71,440 | $75,570 |
| 2016 | $8,211 | $122,680 | $55,440 | $67,240 |
| 2015 | $8,341 | $122,680 | $55,440 | $67,240 |
| 2014 | $8,114 | $122,680 | $55,440 | $67,240 |
| 2013 | $3,992 | $111,510 | $50,400 | $61,110 |
Source: Public Records
Map
Nearby Homes
- 1782 Wyandotte Rd
- 2110 Northwest Blvd
- 1914 Elmwood Ave
- 1733 Elmwood Ave
- 1661 Ashland Ave Unit 663
- 1869 Tewksbury Rd
- 1561 Glenn Ave
- 1398 Lower Green Cir Unit 1398
- 2015 W 5th Ave Unit 211
- 2015 W 5th Ave Unit 102
- 2015 W 5th Ave Unit 108
- 1535 Doone Rd
- 1631 Roxbury Rd Unit F3
- 1631 Roxbury Rd Unit B6
- 1565 Berkshire Rd
- 2063 Westover Rd
- 1459 Elmwood Ave Unit 1459
- 1364 W 7th Ave
- 00 W 7th Ave
- 1313 Lincoln Rd
- 1953 Andover Rd
- 1937 Andover Rd
- 1961 Andover Rd
- 1942 Bedford Rd
- 1950 Bedford Rd
- 1800 Stanford Rd
- 1921 Andover Rd
- 1960 Bedford Rd
- 1946 Andover Rd
- 1969 Andover Rd
- 1936 Andover Rd
- 1956 Andover Rd
- 1924 Bedford Rd
- 1926 Andover Rd
- 1964 Bedford Rd
- 1966 Andover Rd
- 1770 Stanford Rd
- 1976 Andover Rd
- 1981 Andover Rd
- 1795 Edgemont Rd