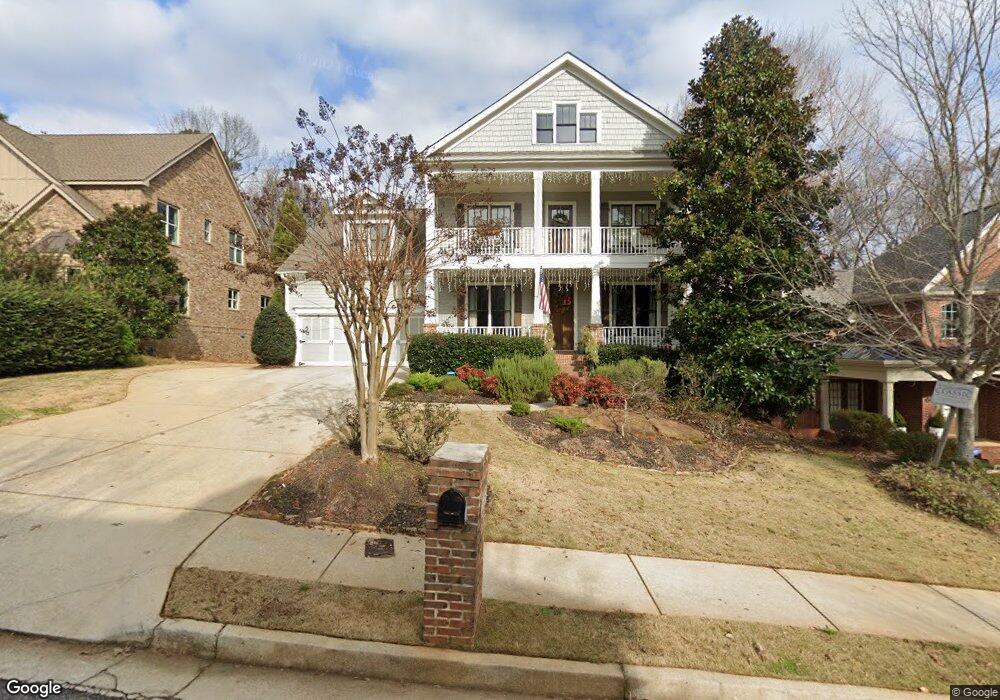
1945 Main St SE Smyrna, GA 30080
Estimated Value: $778,740 - $840,000
4
Beds
3
Baths
3,492
Sq Ft
$233/Sq Ft
Est. Value
About This Home
This home is located at 1945 Main St SE, Smyrna, GA 30080 and is currently estimated at $812,935, approximately $232 per square foot. 1945 Main St SE is a home located in Cobb County with nearby schools including Nickajack Elementary School, Campbell Middle School, and Campbell High School.
Ownership History
Date
Name
Owned For
Owner Type
Purchase Details
Closed on
Dec 14, 2006
Sold by
Busse Gia L and Busse Adam T
Bought by
Smith Lisa S and Boyer Douglas
Current Estimated Value
Home Financials for this Owner
Home Financials are based on the most recent Mortgage that was taken out on this home.
Original Mortgage
$340,000
Outstanding Balance
$200,885
Interest Rate
6.19%
Mortgage Type
New Conventional
Estimated Equity
$612,050
Purchase Details
Closed on
Sep 10, 2004
Sold by
Busse Adam T
Bought by
Busse Adam T and Busse Gia
Home Financials for this Owner
Home Financials are based on the most recent Mortgage that was taken out on this home.
Original Mortgage
$297,000
Interest Rate
5.92%
Purchase Details
Closed on
Aug 25, 2004
Sold by
Singer Ralph and Singer Michelle
Bought by
Busse Adam T
Home Financials for this Owner
Home Financials are based on the most recent Mortgage that was taken out on this home.
Original Mortgage
$297,000
Interest Rate
5.92%
Create a Home Valuation Report for This Property
The Home Valuation Report is an in-depth analysis detailing your home's value as well as a comparison with similar homes in the area
Home Values in the Area
Average Home Value in this Area
Purchase History
| Date | Buyer | Sale Price | Title Company |
|---|---|---|---|
| Smith Lisa S | $595,000 | -- | |
| Busse Adam T | -- | -- | |
| Busse Adam T | $90,000 | -- |
Source: Public Records
Mortgage History
| Date | Status | Borrower | Loan Amount |
|---|---|---|---|
| Open | Smith Lisa S | $340,000 | |
| Previous Owner | Busse Adam T | $297,000 | |
| Previous Owner | Busse Adam T | $81,000 |
Source: Public Records
Tax History Compared to Growth
Tax History
| Year | Tax Paid | Tax Assessment Tax Assessment Total Assessment is a certain percentage of the fair market value that is determined by local assessors to be the total taxable value of land and additions on the property. | Land | Improvement |
|---|---|---|---|---|
| 2025 | $7,222 | $295,188 | $75,176 | $220,012 |
| 2024 | $5,934 | $235,532 | $62,648 | $172,884 |
| 2023 | $5,392 | $235,532 | $62,648 | $172,884 |
| 2022 | $4,282 | $158,008 | $34,008 | $124,000 |
| 2021 | $3,956 | $143,100 | $34,008 | $109,092 |
| 2020 | $3,074 | $110,311 | $19,332 | $90,979 |
| 2019 | $3,446 | $122,568 | $21,480 | $101,088 |
| 2018 | $3,446 | $122,568 | $21,480 | $101,088 |
| 2017 | $2,771 | $105,300 | $14,320 | $90,980 |
| 2016 | $2,772 | $105,300 | $14,320 | $90,980 |
| 2015 | $2,368 | $89,224 | $12,528 | $76,696 |
| 2014 | $2,388 | $89,224 | $0 | $0 |
Source: Public Records
Map
Nearby Homes
- 4492 Oakdale Rd SE
- 2015 Chelton Way SE
- 2011 Chelton Way SE
- 4392 Paces Point Cir SE
- 4428 Wilkerson Manor Dr SE Unit 6
- 4430 Wilkerson Manor Dr SE
- 4471 Redan Ct
- 2209 Croston Ln SE
- 2111 Iverson Dr SE
- 4651 Eddibunn Dr SE
- 2145 W Village Crossing SE
- 1845 Haven Park Cir SE
- 4289 Laurel Creek Ct SE Unit 10
- 4343 Ivy Glen Ct SE
- 4266 Cabretta Dr SE
- 4287 Cabretta Dr SE
- 0 Gaylor St Unit 10203409
- 0 Gaylor St Unit 7275195
- 1910 Cooper Landing Dr SE
- 1914 Cooper Landing Dr SE
- 1955 Main St SE
- 1935 Main St SE
- 4530 Lois St SE
- 4530 Lois St SE
- 4530 Lois St SE Unit 11
- 1965 Main St SE
- 4534 Lois St SE Unit 10
- 4534 Lois St SE
- 4534 Lois St SE
- 1925 Main St SE
- 1975 Main St SE
- 4502 Glenpointe Way SE
- 4538 Lois St SE Unit 9
- 4538 Lois St SE
- 4538 Lois St SE
- 1915 Main St SE Unit 9
- 1915 Main St SE
- 4542 Lois St SE
- 4504 Glenpointe Way SE
- 1985 Main St SE