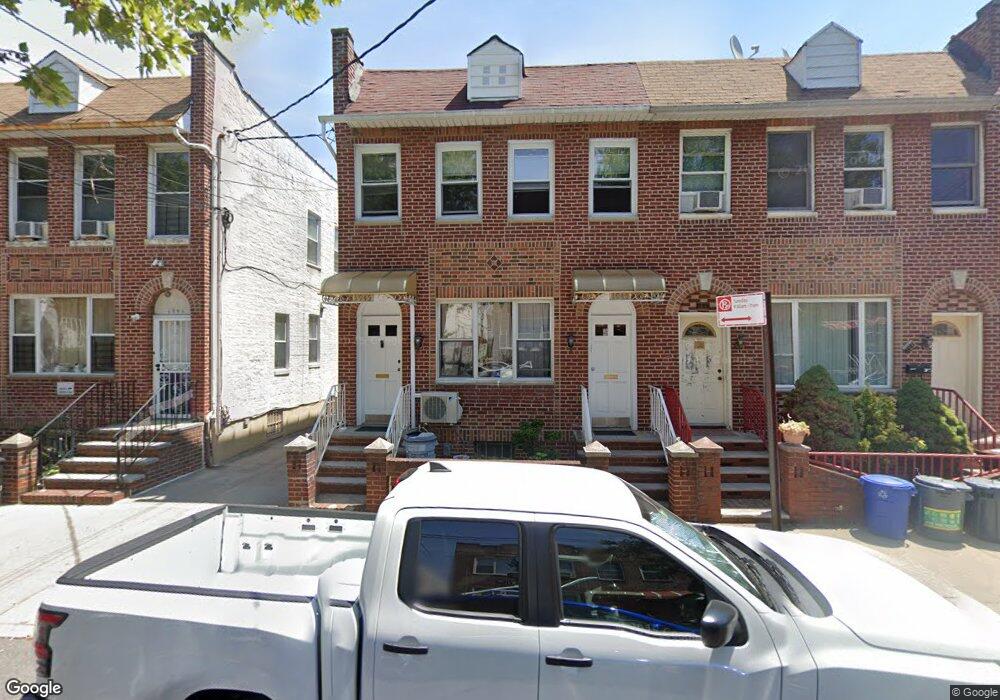
1945 W 10th St Brooklyn, NY 11223
Gravesend NeighborhoodEstimated Value: $1,605,000 - $1,757,000
2
Beds
1
Bath
--
Sq Ft
2,439
Sq Ft Lot
About This Home
This home is located at 1945 W 10th St, Brooklyn, NY 11223 and is currently estimated at $1,680,667. 1945 W 10th St is a home located in Kings County with nearby schools including P.S. 97 - The Highlawn, Is 228 David A Boody, and Hebrew Language Academy Charter 2.
Ownership History
Date
Name
Owned For
Owner Type
Purchase Details
Closed on
Jun 29, 2015
Sold by
Tan Chang Jin
Bought by
Tan Family Irrevocable Trust U/T/D / and Tan, Trustee, Bruce Youbin
Current Estimated Value
Purchase Details
Closed on
Sep 25, 1997
Sold by
Dabusco Vincent Scotto
Bought by
Tan Chang Jin and Tan Yan Yan
Home Financials for this Owner
Home Financials are based on the most recent Mortgage that was taken out on this home.
Original Mortgage
$145,000
Interest Rate
7.23%
Create a Home Valuation Report for This Property
The Home Valuation Report is an in-depth analysis detailing your home's value as well as a comparison with similar homes in the area
Home Values in the Area
Average Home Value in this Area
Purchase History
| Date | Buyer | Sale Price | Title Company |
|---|---|---|---|
| Tan Family Irrevocable Trust U/T/D / | -- | -- | |
| Tan Chang Jin | $285,000 | Stewart Title Insurance Co |
Source: Public Records
Mortgage History
| Date | Status | Borrower | Loan Amount |
|---|---|---|---|
| Previous Owner | Tan Chang Jin | $145,000 |
Source: Public Records
Tax History Compared to Growth
Tax History
| Year | Tax Paid | Tax Assessment Tax Assessment Total Assessment is a certain percentage of the fair market value that is determined by local assessors to be the total taxable value of land and additions on the property. | Land | Improvement |
|---|---|---|---|---|
| 2025 | $4,216 | $93,180 | $16,200 | $76,980 |
| 2024 | $4,216 | $80,640 | $16,200 | $64,440 |
| 2023 | $3,935 | $88,620 | $16,200 | $72,420 |
| 2022 | $3,786 | $83,760 | $16,200 | $67,560 |
| 2021 | $4,006 | $77,640 | $16,200 | $61,440 |
| 2020 | $4,006 | $79,980 | $16,200 | $63,780 |
| 2019 | $3,663 | $70,320 | $16,200 | $54,120 |
| 2018 | $3,314 | $38,983 | $9,089 | $29,894 |
| 2017 | $3,141 | $37,156 | $8,545 | $28,611 |
| 2016 | $3,714 | $37,156 | $9,721 | $27,435 |
| 2015 | $1,675 | $36,499 | $10,798 | $25,701 |
| 2014 | $1,675 | $34,434 | $11,168 | $23,266 |
Source: Public Records
Map
Nearby Homes