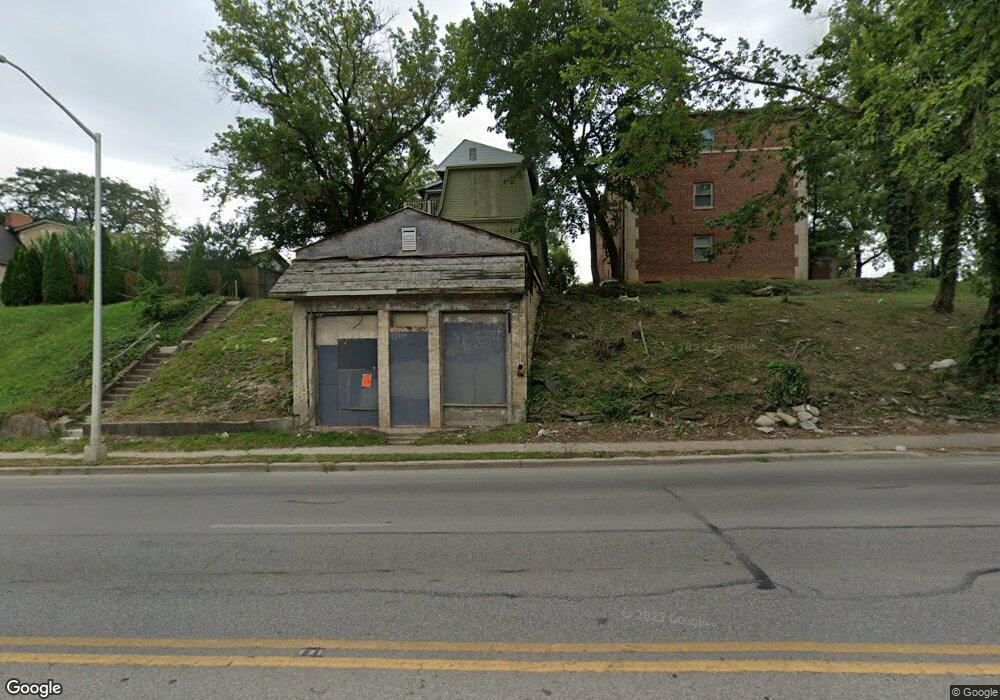
1945 W Broad St Unit 947 Columbus, OH 43223
Central Hilltop NeighborhoodEstimated Value: $104,000 - $190,000
3
Beds
3
Baths
3,238
Sq Ft
$42/Sq Ft
Est. Value
About This Home
This home is located at 1945 W Broad St Unit 947, Columbus, OH 43223 and is currently estimated at $134,589, approximately $41 per square foot. 1945 W Broad St Unit 947 is a home located in Franklin County with nearby schools including Highland Elementary School, Westmoor Middle School, and West High School.
Ownership History
Date
Name
Owned For
Owner Type
Purchase Details
Closed on
Jul 29, 2021
Sold by
Lozano Pedro
Bought by
Lyons Felisha
Current Estimated Value
Purchase Details
Closed on
Oct 20, 2020
Sold by
Duraj Flajdo and Korriku Besmir
Bought by
Lozano Pedro
Purchase Details
Closed on
Jul 9, 2020
Sold by
Gc3 Capital Corporation
Bought by
Duraj Flajdo and Korriku Besmir
Purchase Details
Closed on
May 26, 2020
Sold by
Burns Ryan M and Burns Michelle Lang
Bought by
Gc3 Capital Corporation
Purchase Details
Closed on
Jun 1, 2016
Sold by
Burns Shaun D
Bought by
Burns Ryan M
Purchase Details
Closed on
May 15, 2015
Sold by
Burns Michele L and Burns Michel Long
Bought by
Burns Shaun D
Purchase Details
Closed on
Dec 22, 2010
Sold by
Mcintyre Pauline E and Mcintyre Pauline Elizabeth
Bought by
Burns Michele Lang
Purchase Details
Closed on
Dec 6, 1993
Bought by
Mcintyre Pauline E Afdt
Purchase Details
Closed on
Feb 7, 1991
Create a Home Valuation Report for This Property
The Home Valuation Report is an in-depth analysis detailing your home's value as well as a comparison with similar homes in the area
Home Values in the Area
Average Home Value in this Area
Purchase History
| Date | Buyer | Sale Price | Title Company |
|---|---|---|---|
| Lyons Felisha | $76,500 | Valmer Land Title Agency Llc | |
| Lozano Pedro | $75,000 | Bridge T&E Svcs Llc | |
| Duraj Flajdo | $30,000 | Bridge T&E Svcs Llc | |
| Gc3 Capital Corporation | $13,000 | Bridge T&E Svcs Llc | |
| Burns Ryan M | $13,500 | None Available | |
| Burns Shaun D | -- | Attorney | |
| Burns Michele Lang | $13,500 | Attorney | |
| Mcintyre Pauline E Afdt | -- | -- | |
| -- | -- | -- |
Source: Public Records
Tax History Compared to Growth
Tax History
| Year | Tax Paid | Tax Assessment Tax Assessment Total Assessment is a certain percentage of the fair market value that is determined by local assessors to be the total taxable value of land and additions on the property. | Land | Improvement |
|---|---|---|---|---|
| 2024 | $3,755 | $41,660 | $6,270 | $35,390 |
| 2023 | $1,885 | $41,650 | $6,265 | $35,385 |
| 2022 | $1,078 | $16,630 | $2,590 | $14,040 |
| 2021 | $877 | $16,630 | $2,590 | $14,040 |
| 2020 | $1,160 | $21,980 | $2,590 | $19,390 |
| 2019 | $3,624 | $18,340 | $2,170 | $16,170 |
| 2018 | $983 | $18,340 | $2,170 | $16,170 |
| 2017 | $1,164 | $18,340 | $2,170 | $16,170 |
| 2016 | $1,189 | $4,730 | $4,380 | $350 |
| 2015 | $146 | $4,730 | $4,380 | $350 |
| 2014 | $146 | $4,730 | $4,380 | $350 |
| 2013 | $146 | $4,725 | $4,375 | $350 |
Source: Public Records
Map
Nearby Homes
- 1931 W Broad St Unit 933
- 1987 Fairmont Ave
- 1936 Floral Ave
- 83-93 Lechner Ave
- 1923 Floral Ave
- 2014 Floral Ave
- 2045 W Broad St
- 45 Belvidere Ave
- 69 Belvidere Ave
- 162 Columbian Ave Unit 164
- 2263 W Broad St
- 196 Belvidere Ave
- 258 Lechner Ave
- 264 Nashoba Ave
- 107-109 Midland Ave
- 319 Columbian Ave
- 253 Whitethorne Ave
- 249 Midland Ave
- 306 Whitethorne Ave
- 365 Lechner Ave
- 1945-1947 W Broad St
- 1945 W Broad St Unit 47
- 1935 W Broad St Unit 937
- 1963 W Broad St
- 1948 Fairmont Ave
- 1954-1956 Fairmont Ave
- 1944 Fairmont Ave
- 1960 Fairmont Ave
- 1954 Fairmont Ave Unit 956
- 1966 Fairmont Ave Unit 968
- 1936 Fairmont Ave
- 1982 Fairmont Ave
- 1999 W Broad St
- 1986 Fairmont Ave Unit 988
- 1992-1994 Fairmont Ave
- 1992 Fairmont Ave Unit 4
- 1947 Fairmont Ave
- 1953 Fairmont Ave Unit 955
- 1953 Fairmont Ave Unit 55
- 1997-1999 W Broad St