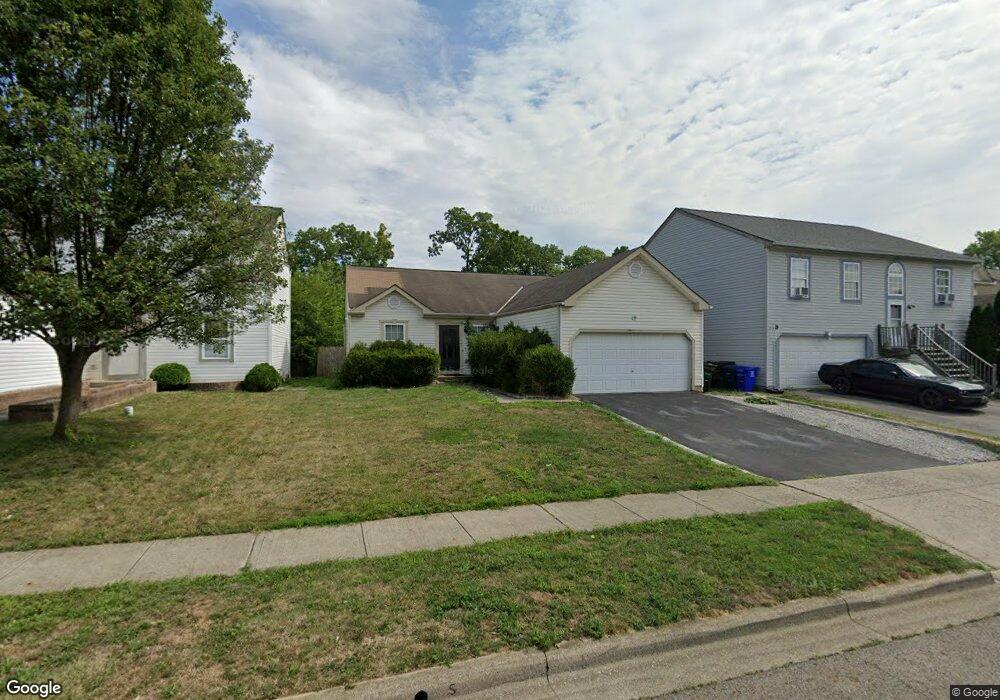
1946 Arden Forest Ln Columbus, OH 43223
Estimated Value: $223,000 - $278,000
3
Beds
3
Baths
1,516
Sq Ft
$171/Sq Ft
Est. Value
About This Home
This home is located at 1946 Arden Forest Ln, Columbus, OH 43223 and is currently estimated at $259,151, approximately $170 per square foot. 1946 Arden Forest Ln is a home located in Franklin County with nearby schools including Finland Elementary School, Franklin Woods Intermediate School, and Finland Middle School.
Ownership History
Date
Name
Owned For
Owner Type
Purchase Details
Closed on
Oct 29, 2010
Sold by
Secretary Of Housing & Urban Development
Bought by
Barfield Terry L
Current Estimated Value
Home Financials for this Owner
Home Financials are based on the most recent Mortgage that was taken out on this home.
Original Mortgage
$78,732
Outstanding Balance
$53,202
Interest Rate
4.75%
Mortgage Type
FHA
Estimated Equity
$205,949
Purchase Details
Closed on
Jun 8, 2010
Sold by
Miller Lane K and Case #09Cve 04 5563
Bought by
Wells Fargo Bank Na
Purchase Details
Closed on
Apr 30, 2010
Sold by
Wells Fargo Bank Na
Bought by
Secretary Of Housing & Urban Development
Purchase Details
Closed on
Feb 24, 2004
Sold by
Maronda Homes Inc Of Ohio
Bought by
Miller Lane K
Create a Home Valuation Report for This Property
The Home Valuation Report is an in-depth analysis detailing your home's value as well as a comparison with similar homes in the area
Home Values in the Area
Average Home Value in this Area
Purchase History
| Date | Buyer | Sale Price | Title Company |
|---|---|---|---|
| Barfield Terry L | $77,501 | Lakeside Ti | |
| Wells Fargo Bank Na | $72,000 | None Available | |
| Secretary Of Housing & Urban Development | -- | None Available | |
| Miller Lane K | $125,800 | -- |
Source: Public Records
Mortgage History
| Date | Status | Borrower | Loan Amount |
|---|---|---|---|
| Open | Barfield Terry L | $78,732 |
Source: Public Records
Tax History Compared to Growth
Tax History
| Year | Tax Paid | Tax Assessment Tax Assessment Total Assessment is a certain percentage of the fair market value that is determined by local assessors to be the total taxable value of land and additions on the property. | Land | Improvement |
|---|---|---|---|---|
| 2024 | $3,650 | $80,050 | $19,250 | $60,800 |
| 2023 | $2,867 | $80,045 | $19,250 | $60,795 |
| 2022 | $1,634 | $31,850 | $8,330 | $23,520 |
| 2021 | $1,586 | $31,850 | $8,330 | $23,520 |
| 2020 | $1,577 | $31,850 | $8,330 | $23,520 |
| 2019 | $1,347 | $24,010 | $6,650 | $17,360 |
| 2018 | $1,838 | $24,010 | $6,650 | $17,360 |
| 2017 | $1,813 | $24,010 | $6,650 | $17,360 |
| 2016 | $2,292 | $37,880 | $6,270 | $31,610 |
| 2015 | $2,292 | $37,880 | $6,270 | $31,610 |
| 2014 | $2,294 | $37,880 | $6,270 | $31,610 |
| 2013 | $1,196 | $39,830 | $6,580 | $33,250 |
Source: Public Records
Map
Nearby Homes
- 1994 Little Ave
- 1390 Gray Meadow Dr
- 1417 Fahy Dr
- 1757 Linnet Ave
- 1723 Farberdale Dr
- 1663 Hopkins Ave
- 2210 October Ridge Dr
- 2180 Eakin Rd
- 1417 Brown Rd
- 1543 Red Leaf Ln
- 1532 Westmeadow Dr
- 1540 Little Ave
- 1743 Ransburg Ave
- 1607 Red Leaf Ln
- 2336 Woodbrook Cir N Unit 92 B
- 1617 Ransburg Ave
- 2362 Woodbrook Cir N Unit 81
- 1085 Hardesty Place E Unit 4
- 1119 Hardesty Place E Unit 1
- 2382 Hardesty Dr S Unit Q-5
- 1952 Arden Forest Ln
- 1940 Arden Forest Ln
- 1934 Arden Forest Ln
- 1958 Arden Forest Ln
- 1964 Arden Forest Ln
- 1928 Arden Forest Ln
- 1947 Arden Forest Ln
- 1941 Arden Forest Ln
- 1953 Arden Forest Ln
- 1935 Arden Forest Ln
- 1970 Arden Forest Ln
- 1959 Arden Forest Ln
- 1929 Arden Forest Ln
- 1922 Arden Forest Ln
- 1965 Arden Forest Ln
- 1976 Arden Forest Ln
- 1289 Forest Dr
- 1923 Arden Forest Ln
- 1947 Little Ave
- 1941 Little Ave