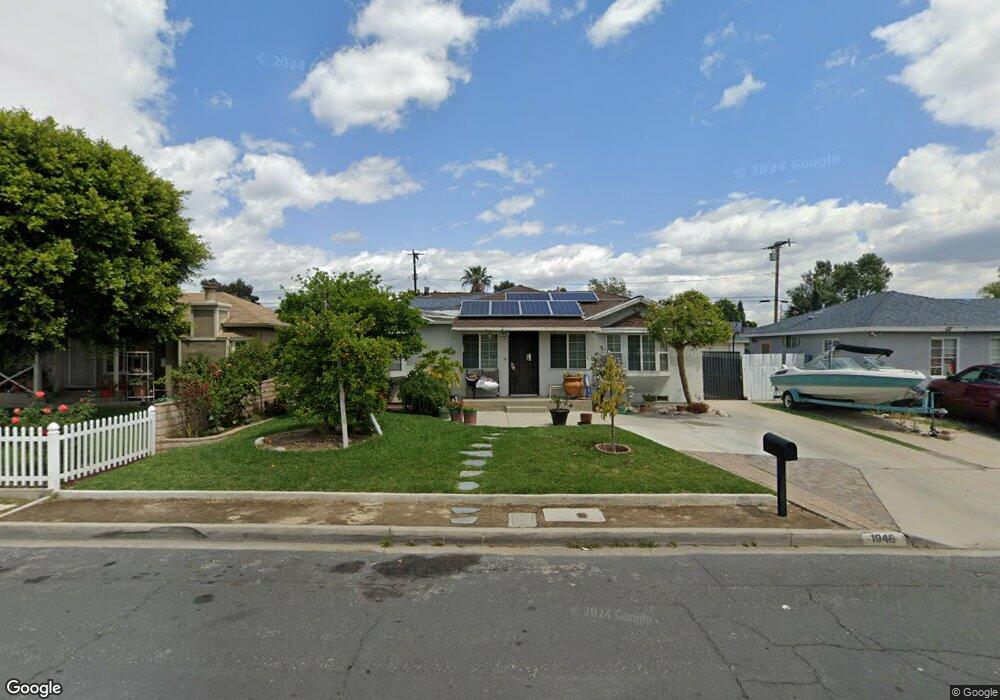
1946 Delford Ave Duarte, CA 91010
Estimated Value: $691,000 - $767,000
3
Beds
2
Baths
1,178
Sq Ft
$618/Sq Ft
Est. Value
About This Home
This home is located at 1946 Delford Ave, Duarte, CA 91010 and is currently estimated at $727,595, approximately $617 per square foot. 1946 Delford Ave is a home located in Los Angeles County with nearby schools including Beardslee Dual Language Immersion Academy (Pk-8), Duarte High School, and California School Of The Arts - San Gabriel Valley.
Ownership History
Date
Name
Owned For
Owner Type
Purchase Details
Closed on
Jun 4, 2002
Sold by
Martinez Rodrigo
Bought by
Gonzalez Jesus Najera
Current Estimated Value
Home Financials for this Owner
Home Financials are based on the most recent Mortgage that was taken out on this home.
Original Mortgage
$140,000
Interest Rate
6.74%
Purchase Details
Closed on
Jun 3, 1996
Sold by
Suarez Epifanio A
Bought by
Gonzalez Jesus Majera and Najera Maria Trinidad
Home Financials for this Owner
Home Financials are based on the most recent Mortgage that was taken out on this home.
Original Mortgage
$142,865
Interest Rate
7.96%
Mortgage Type
FHA
Purchase Details
Closed on
Mar 23, 1994
Sold by
Suarez Celia Guerrero
Bought by
Suarez Epifanio A
Home Financials for this Owner
Home Financials are based on the most recent Mortgage that was taken out on this home.
Original Mortgage
$56,000
Interest Rate
7.15%
Create a Home Valuation Report for This Property
The Home Valuation Report is an in-depth analysis detailing your home's value as well as a comparison with similar homes in the area
Home Values in the Area
Average Home Value in this Area
Purchase History
| Date | Buyer | Sale Price | Title Company |
|---|---|---|---|
| Gonzalez Jesus Najera | -- | Fidelity Title | |
| Gonzalez Jesus Majera | $145,000 | Equity Title Company | |
| Suarez Epifanio A | -- | Fidelity National Title |
Source: Public Records
Mortgage History
| Date | Status | Borrower | Loan Amount |
|---|---|---|---|
| Closed | Gonzalez Jesus Najera | $140,000 | |
| Previous Owner | Gonzalez Jesus Majera | $142,865 | |
| Previous Owner | Suarez Epifanio A | $56,000 |
Source: Public Records
Tax History Compared to Growth
Tax History
| Year | Tax Paid | Tax Assessment Tax Assessment Total Assessment is a certain percentage of the fair market value that is determined by local assessors to be the total taxable value of land and additions on the property. | Land | Improvement |
|---|---|---|---|---|
| 2025 | $3,960 | $261,255 | $132,744 | $128,511 |
| 2024 | $3,960 | $256,134 | $130,142 | $125,992 |
| 2023 | $3,854 | $251,113 | $127,591 | $123,522 |
| 2022 | $3,765 | $246,190 | $125,090 | $121,100 |
| 2021 | $3,718 | $241,364 | $122,638 | $118,726 |
| 2019 | $3,485 | $234,206 | $119,001 | $115,205 |
| 2018 | $3,273 | $229,615 | $116,668 | $112,947 |
| 2016 | $3,127 | $220,701 | $112,139 | $108,562 |
| 2015 | $3,064 | $217,387 | $110,455 | $106,932 |
| 2014 | $3,039 | $213,130 | $108,292 | $104,838 |
Source: Public Records
Map
Nearby Homes
- 2047 Delford Ave
- 1823 Broadland Ave
- 1619 Shepherd Dr
- 1900 Mountain Ave
- 874 Cinnamon Ln Unit 62
- 826 Cinnamon Ln
- 2024 Mountain Ave
- 2048 Felberg Ave
- 1214 Huntington Dr Unit I
- 1245 Oliva Ct
- 1035 E Huntington Dr Unit 28
- 1000 Cabrillo Dr
- 1020 S Mountain Ave Unit 15
- 2112 California Ave
- 1408 S California Ave Unit C
- 1406 S California Ave Unit C
- 1672 3rd St
- 1305 1/2 Santo Domingo Ave
- 1832 Huntington Dr Unit 13
- 322 Joella St
- 1940 Delford Ave
- 1950 Delford Ave
- 1934 Delford Ave
- 1956 Delford Ave
- 1945 Earlington Ave
- 1941 Earlington Ave
- 1951 Earlington Ave
- 1935 Earlington Ave
- 1928 Delford Ave
- 1957 Earlington Ave
- 1945 Delford Ave
- 1941 Delford Ave
- 1951 Delford Ave
- 1935 Delford Ave
- 1957 Delford Ave
- 1924 Delford Ave
- 1931 Delford Ave
- 1925 Earlington Ave
- 1918 Delford Ave
- 1946 Broadland Ave