
Landlord's Agent in 2022
Athena Petersen
Long & Foster
(571) 217-8900


Estimated Value: $284,000 - $354,000
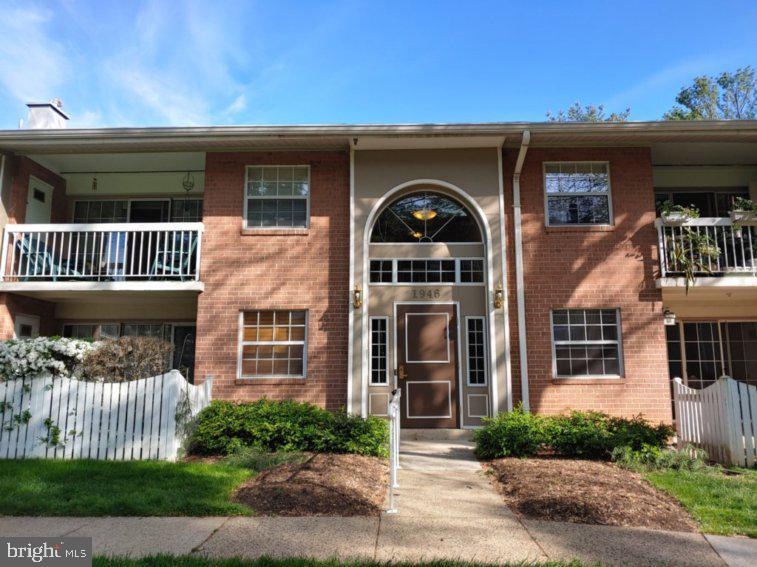
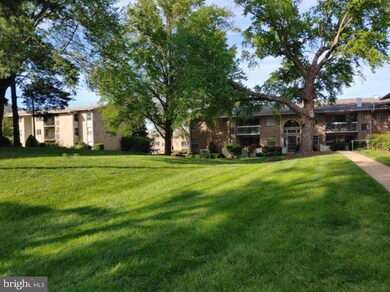
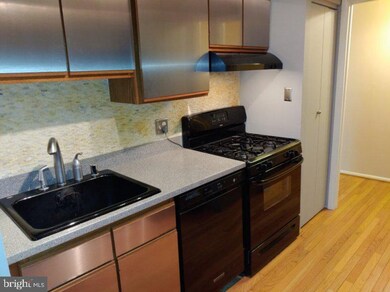
SPACIOUS 1 BEDROOM CONDO IN MCLEAN LOCATION & INSIDE THE BELTWAY. BEAUTIFUL GLEAMING HARDWOOD FLOORS. STYLISH KITCHEN WITH FORGIVING CORIAN COUNTER-TOPS. LARGE BEDROOM WITH CEILING FAN & WALK IN CLOSET WITH PLENTY OF ORGANIZED SHELVING. BUILT-IN DESK/OFFICE NOOK IN BEDROOM! FENCED GARDEN PATIO NICELY LANDSCAPED. 1.5 MILES TO "MCLEAN METRO" STATION (SILVER LINE) AND 1.8 MILES TO THE "TYSONS METRO" STATION (SILVER LINE). AND OH SO CLOSE TO TYSONS CORNER CENTER & TYSONS GALLERIA AND MUCH MORE! BONUS, GAS & WATER INCLUDED IN RENT. ASK FOR AVAILABILITY (WHICH IS SUBJECT TO CHANGE). THIS IS A LONG & FOSTER PROPERTY MANAGED PROPERTY. PET POLICY IS "CASE BY CASE". WHY BUY WHEN YOU CAN RENT THIS GEM!
Last Agent to Rent the Property
(571) 217-8900 athena.petersen@longandfoster.com Long & Foster Real Estate, Inc. License #0225066306 Listed on: 12/27/2021
| Date | Buyer | Sale Price | Title Company |
|---|---|---|---|
| Vanderveen Mark A | $255,000 | -- |
| Date | Status | Borrower | Loan Amount |
|---|---|---|---|
| Open | Vanderveen Mark A | $242,250 |
| Date | Event | Price | List to Sale | Price per Sq Ft |
|---|---|---|---|---|
| 01/08/2022 01/08/22 | Rented | $1,600 | 0.0% | -- |
| 01/05/2022 01/05/22 | Off Market | $1,600 | -- | -- |
| 12/27/2021 12/27/21 | For Rent | $1,600 | +10.3% | -- |
| 06/21/2021 06/21/21 | Rented | $1,450 | 0.0% | -- |
| 06/12/2021 06/12/21 | Off Market | $1,450 | -- | -- |
| 06/04/2021 06/04/21 | Price Changed | $1,450 | -3.3% | $2 / Sq Ft |
| 05/24/2021 05/24/21 | Price Changed | $1,500 | -7.7% | $2 / Sq Ft |
| 05/05/2021 05/05/21 | For Rent | $1,625 | +3.2% | -- |
| 04/30/2018 04/30/18 | Rented | $1,575 | 0.0% | -- |
| 04/30/2018 04/30/18 | Under Contract | -- | -- | -- |
| 04/20/2018 04/20/18 | For Rent | $1,575 | +5.0% | -- |
| 06/14/2016 06/14/16 | Rented | $1,500 | 0.0% | -- |
| 06/10/2016 06/10/16 | Under Contract | -- | -- | -- |
| 04/29/2016 04/29/16 | For Rent | $1,500 | +3.4% | -- |
| 12/22/2014 12/22/14 | Rented | $1,450 | 0.0% | -- |
| 12/22/2014 12/22/14 | Under Contract | -- | -- | -- |
| 10/23/2014 10/23/14 | For Rent | $1,450 | 0.0% | -- |
| 12/16/2013 12/16/13 | Rented | $1,450 | -3.3% | -- |
| 12/16/2013 12/16/13 | Under Contract | -- | -- | -- |
| 10/31/2013 10/31/13 | For Rent | $1,500 | 0.0% | -- |
| 04/24/2012 04/24/12 | Rented | $1,500 | +3.4% | -- |
| 03/25/2012 03/25/12 | Under Contract | -- | -- | -- |
| 03/19/2012 03/19/12 | For Rent | $1,450 | -- | -- |
| Year | Tax Paid | Tax Assessment Tax Assessment Total Assessment is a certain percentage of the fair market value that is determined by local assessors to be the total taxable value of land and additions on the property. | Land | Improvement |
|---|---|---|---|---|
| 2025 | $3,277 | $287,420 | $57,000 | $230,420 |
| 2024 | $3,277 | $271,150 | $54,000 | $217,150 |
| 2023 | $3,073 | $260,720 | $52,000 | $208,720 |
| 2022 | $2,936 | $245,960 | $49,000 | $196,960 |
| 2021 | $3,009 | $245,960 | $49,000 | $196,960 |
| 2020 | $2,638 | $213,880 | $43,000 | $170,880 |
| 2019 | $2,595 | $210,350 | $42,000 | $168,350 |
| 2018 | $2,304 | $200,330 | $40,000 | $160,330 |
| 2017 | $2,552 | $210,770 | $42,000 | $168,770 |
| 2016 | $2,601 | $215,210 | $43,000 | $172,210 |
| 2015 | $2,302 | $197,440 | $39,000 | $158,440 |
| 2014 | $2,277 | $197,440 | $39,000 | $158,440 |
Landlord's Agent in 2022
Athena Petersen
Long & Foster
(571) 217-8900
Tenant's Agent in 2022
Jean Reid
Weichert Corporate
(703) 336-3808
14 Total Sales
Seller's Agent in 2021
Michael Baron
Richey Real Estate Services
(703) 471-4800
13 Total Sales
Seller Co-Listing Agent in 2021
ET Tulu
Century 21 Accent Homes
(571) 338-2106
D
Seller's Agent in 2018
Dave Anderson
Chambers Theory, LLC
(703) 969-9333
3 Total Sales
G
Buyer's Agent in 2018
Gabrielle Bergeret
Long & Foster
Source: Bright MLS
MLS Number: VAFX2037286
APN: 0392-423C0101
Disclaimer: Certain information contained herein is derived from information provided by parties other than Homes.com. All information provided is deemed reliable, but is not guaranteed to be accurate and should be independently verified.
![]() The data relating to real estate for sale on this website appears in part through the BRIGHT Internet Data Exchange program, a voluntary cooperative exchange of property listing data between licensed real estate brokerage firms, and is provided by BRIGHT through a licensing agreement.
The data relating to real estate for sale on this website appears in part through the BRIGHT Internet Data Exchange program, a voluntary cooperative exchange of property listing data between licensed real estate brokerage firms, and is provided by BRIGHT through a licensing agreement.
Listing information is from various brokers who participate in the Bright MLS IDX program and not all listings may be visible on the site.
The property information being provided on or through the website is for the personal, non-commercial use of consumers and such information may not be used for any purpose other than to identify prospective properties consumers may be interested in purchasing.
Some properties which appear for sale on the website may no longer be available because they are for instance, under contract, sold or are no longer being offered for sale.
Property information displayed is deemed reliable but is not guaranteed.
Copyright 2025 Bright MLS, Inc.