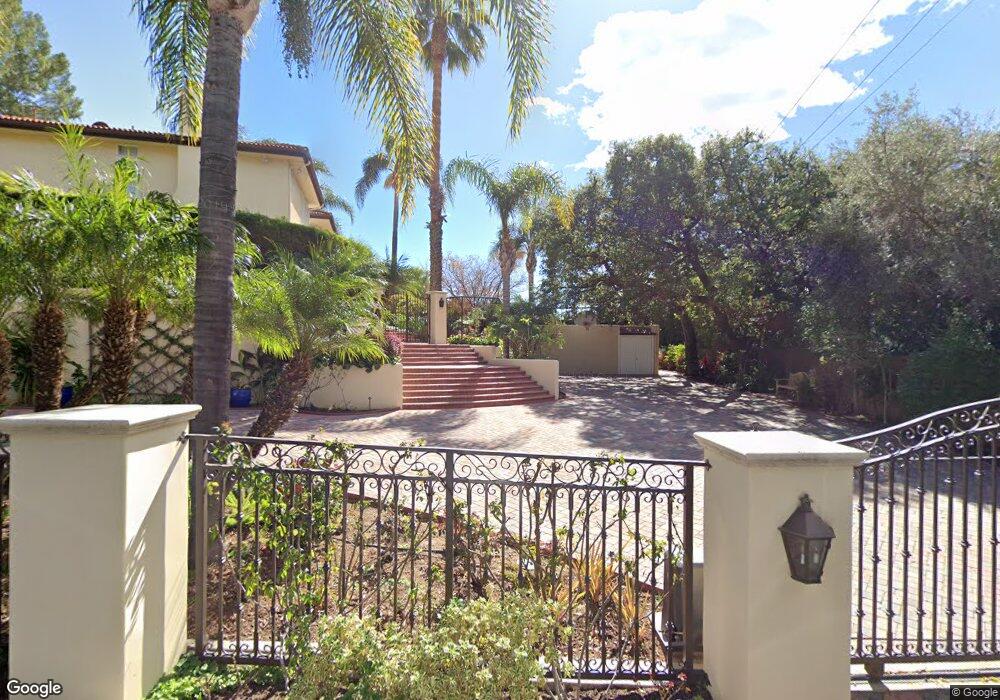
1946 Lamp Post Ln La Canada Flintridge, CA 91011
Estimated Value: $4,794,329 - $5,458,000
5
Beds
7
Baths
5,752
Sq Ft
$888/Sq Ft
Est. Value
About This Home
This home is located at 1946 Lamp Post Ln, La Canada Flintridge, CA 91011 and is currently estimated at $5,106,582, approximately $887 per square foot. 1946 Lamp Post Ln is a home located in Los Angeles County with nearby schools including Palm Crest Elementary School, La Canada High School, and Montrose Christian Montessori School.
Ownership History
Date
Name
Owned For
Owner Type
Purchase Details
Closed on
Jan 22, 2001
Sold by
Chandramohan Sathy and Chandramohan Geeta Pararajasegaram
Bought by
Chandramohan Sathiyamorthy
Current Estimated Value
Purchase Details
Closed on
Aug 13, 1996
Sold by
Anderson Raymond B
Bought by
Chandramohan Sathy and Chandramohan Geeta Pararajasegaram
Home Financials for this Owner
Home Financials are based on the most recent Mortgage that was taken out on this home.
Original Mortgage
$1,000,000
Outstanding Balance
$80,528
Interest Rate
8.42%
Estimated Equity
$5,026,054
Purchase Details
Closed on
Nov 23, 1993
Sold by
Reuss Jerry
Bought by
Anderson Raymond B
Home Financials for this Owner
Home Financials are based on the most recent Mortgage that was taken out on this home.
Original Mortgage
$1,000,000
Interest Rate
4.5%
Create a Home Valuation Report for This Property
The Home Valuation Report is an in-depth analysis detailing your home's value as well as a comparison with similar homes in the area
Home Values in the Area
Average Home Value in this Area
Purchase History
| Date | Buyer | Sale Price | Title Company |
|---|---|---|---|
| Chandramohan Sathiyamorthy | -- | -- | |
| Chandramohan Sathy | $1,275,000 | Equity Title | |
| Anderson Raymond B | $1,300,000 | -- |
Source: Public Records
Mortgage History
| Date | Status | Borrower | Loan Amount |
|---|---|---|---|
| Open | Chandramohan Sathy | $1,000,000 | |
| Previous Owner | Anderson Raymond B | $1,000,000 |
Source: Public Records
Tax History Compared to Growth
Tax History
| Year | Tax Paid | Tax Assessment Tax Assessment Total Assessment is a certain percentage of the fair market value that is determined by local assessors to be the total taxable value of land and additions on the property. | Land | Improvement |
|---|---|---|---|---|
| 2025 | $25,632 | $2,200,850 | $766,786 | $1,434,064 |
| 2024 | $25,632 | $2,157,697 | $751,751 | $1,405,946 |
| 2023 | $25,050 | $2,115,390 | $737,011 | $1,378,379 |
| 2022 | $24,085 | $2,073,912 | $722,560 | $1,351,352 |
| 2021 | $23,582 | $2,033,248 | $708,393 | $1,324,855 |
| 2019 | $22,855 | $1,972,943 | $687,383 | $1,285,560 |
| 2018 | $22,280 | $1,934,258 | $673,905 | $1,260,353 |
| 2016 | $21,373 | $1,859,151 | $647,738 | $1,211,413 |
| 2015 | $21,068 | $1,831,226 | $638,009 | $1,193,217 |
| 2014 | $20,780 | $1,795,356 | $625,512 | $1,169,844 |
Source: Public Records
Map
Nearby Homes
- 0 La Sierra & Palm Dr
- 5245 Bubbling Well Ln
- 5260 Palm Dr
- 1737 Fairmount Ave
- 1735 Fairmount Ave
- 4940 Ocean View Blvd
- 1929 Lyans Dr
- 5404 Rock Castle Dr
- 5447 Rock Castle Dr
- 2430 Orange Ave
- 4644 Hillard Ave
- 4479 Rockland Place
- 2102 La Canada Crest Dr Unit B
- 4430 Rosebank Dr
- 4639 El Camino Corto
- 5123 Caroli Ln
- 4326 Briggs Ave
- 2619 Mary St
- 2434 Prospect Ave
- 2409 Olive Ave
- 5326 Jessen Dr
- 1959 Lamp Post Ln
- 1930 Lamp Post Ln
- 5330 Jessen Dr
- 1925 Lamp Post Ln
- 1969 Lamp Post Ln
- 5222 Jessen Dr
- 1924 Lamp Post Ln
- 5310 Jessen Dr
- 5217 Jessen Dr
- 5223 Jessen Dr
- 5220 Jessen Dr
- 1920 Lamp Post Ln
- 5225 Jessen Dr
- 5350 Jessen Dr
- 5214 Jessen Dr
- 5333 Jessen Dr
- 1915 Lamp Post Ln
- 5329 Jessen Dr
- 2031 Los Amigos St