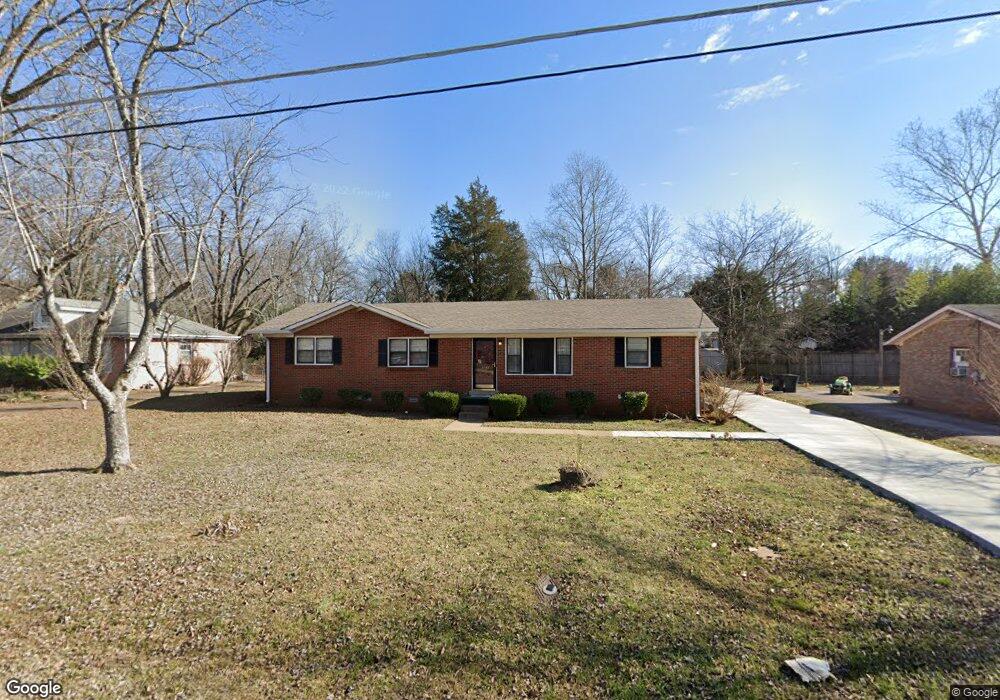
1946 Ransom Dr Murfreesboro, TN 37130
Estimated Value: $243,256 - $344,000
Studio
1
Bath
1,400
Sq Ft
$218/Sq Ft
Est. Value
About This Home
This home is located at 1946 Ransom Dr, Murfreesboro, TN 37130 and is currently estimated at $304,814, approximately $217 per square foot. 1946 Ransom Dr is a home located in Rutherford County with nearby schools including Black Fox Elementary School, Whitworth-Buchanan Middle School, and Riverdale High School.
Ownership History
Date
Name
Owned For
Owner Type
Purchase Details
Closed on
Sep 13, 1996
Sold by
Mcginn Kevin F
Bought by
Sanders Brenda G
Current Estimated Value
Purchase Details
Closed on
Jan 10, 1995
Sold by
Sterling Harrell
Bought by
Mcginn Kevin F
Purchase Details
Closed on
Nov 23, 1994
Sold by
Ward Ann S Trustee
Bought by
Sterling Harrell
Create a Home Valuation Report for This Property
The Home Valuation Report is an in-depth analysis detailing your home's value as well as a comparison with similar homes in the area
Home Values in the Area
Average Home Value in this Area
Purchase History
| Date | Buyer | Sale Price | Title Company |
|---|---|---|---|
| Sanders Brenda G | $70,000 | -- | |
| Mcginn Kevin F | $58,500 | -- | |
| Sterling Harrell | $48,500 | -- |
Source: Public Records
Tax History
| Year | Tax Paid | Tax Assessment Tax Assessment Total Assessment is a certain percentage of the fair market value that is determined by local assessors to be the total taxable value of land and additions on the property. | Land | Improvement |
|---|---|---|---|---|
| 2025 | $1,511 | $53,425 | $13,750 | $39,675 |
| 2024 | $1,511 | $53,425 | $13,750 | $39,675 |
| 2023 | $1,002 | $53,425 | $13,750 | $39,675 |
| 2022 | $863 | $53,425 | $13,750 | $39,675 |
| 2021 | $774 | $34,875 | $9,375 | $25,500 |
| 2020 | $774 | $34,875 | $9,375 | $25,500 |
| 2019 | $774 | $34,875 | $9,375 | $25,500 |
| 2018 | $1,063 | $34,875 | $0 | $0 |
| 2017 | $973 | $25,050 | $0 | $0 |
| 2016 | $973 | $25,050 | $0 | $0 |
| 2015 | $973 | $25,050 | $0 | $0 |
| 2014 | $623 | $25,050 | $0 | $0 |
| 2013 | -- | $18,875 | $0 | $0 |
Source: Public Records
Map
Nearby Homes
- 1806 Fern Dr
- 2010 Bartway Dr Unit 2012
- 1610 Bartway Dr
- 1534 Kensington Dr
- 1519 Kensington Dr
- 1710 Clydeway Dr
- 1811 Cascade Ct
- 1919 Bradyville Pike
- 2252 Viking Ct
- 1507 Bartway Dr
- 2260 Viking Ct
- 1214 Rutherford St
- 2015 Olympia Place
- 2422 Turtle Trace
- 1510 Foxdale Dr
- 2103 Halligen Ct
- 1030 Hunt St
- 1729 Twelve Oaks Ln
- 1709 Thomas Ct
- 2511 Lismore Dr
- 1950 Ransom Dr
- 1942 Ransom Dr
- 1943 Russell Ct
- 1939 Russell Ct
- 1954 Ransom Dr
- 1938 Ransom Dr
- 1971 Ransom Dr
- 1958 Ransom Dr
- 1987 Ransom Dr
- 1934 Ransom Dr
- 1935 Russell Ct
- 1967 Ransom Dr
- 1963 Ransom Dr
- 1975 Ransom Ct
- 1927 Russell Ct
- 2006 Lynch Dr
- 1930 Ransom Dr
- 1959 Ransom Dr
- 1991 Ransom Dr
- 1983 Ransom Ct Unit 1985
Your Personal Tour Guide
Ask me questions while you tour the home.