1946 Tyler Ct Placentia, CA 92870
Estimated Value: $1,002,743 - $1,119,000
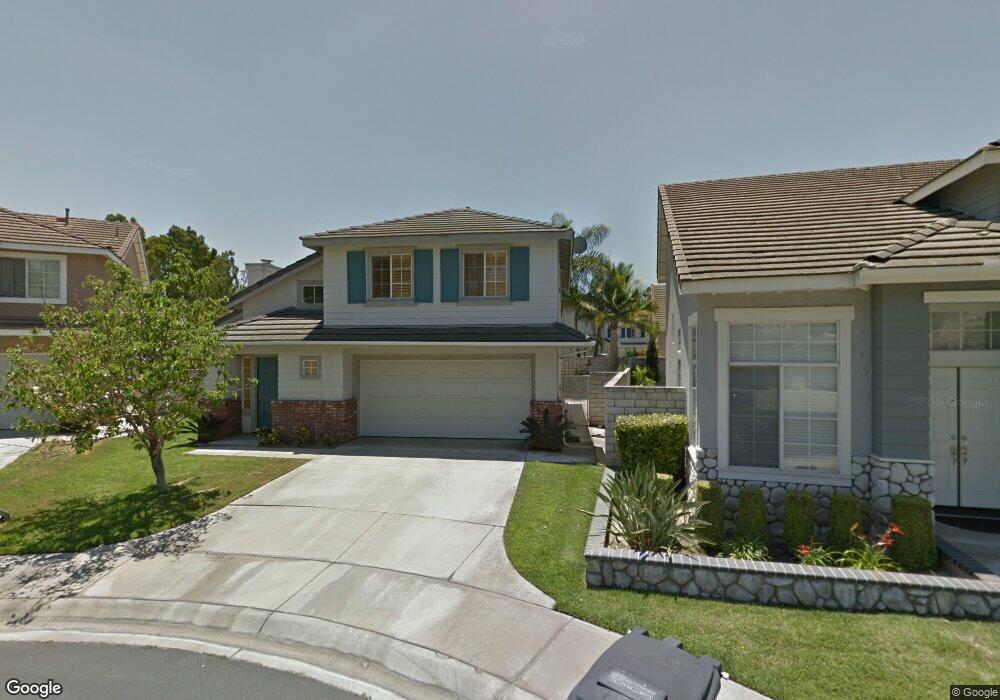
About This Home
This home is located at 1946 Tyler Ct, Placentia, CA 92870 and is currently estimated at $1,068,936, approximately $557 per square foot. 1946 Tyler Ct is a home located in Orange County with nearby schools including Glenview Elementary School, Bernardo Yorba Middle School, and Independence Christian School.
Ownership History
We collect this data history from publicly available records. To have your information removed, we recommend requesting removal directly through your county’s website.
Purchase Details
Purchase Details
Home Financials for this Owner
Home Financials are based on the most recent Mortgage that was taken out on this home.Home Values in the Area
Average Home Value in this Area
Purchase History
We collect this data history from publicly available records. To have your information removed, we recommend requesting removal directly through your county’s website.
| Date | Buyer | Sale Price | Title Company |
|---|---|---|---|
| -- | -- | ||
| $216,000 | First American Title Ins |
Mortgage History
We collect this data history from publicly available records. To have your information removed, we recommend requesting removal directly through your county’s website.
| Date | Status | Borrower | Loan Amount |
|---|---|---|---|
| Open | $172,637 |
Tax History
We collect this data history from publicly available records. To have your information removed, we recommend requesting removal directly through your county’s website.
| Year | Tax Paid | Tax Assessment Tax Assessment Total Assessment is a certain percentage of the fair market value that is determined by local assessors to be the total taxable value of land and additions on the property. | Land | Improvement |
|---|---|---|---|---|
| 2025 | $4,691 | $356,946 | $139,311 | $217,635 |
| 2024 | $4,691 | $349,948 | $136,580 | $213,368 |
| 2023 | $4,568 | $343,087 | $133,902 | $209,185 |
| 2022 | $4,470 | $336,360 | $131,276 | $205,084 |
| 2021 | $4,338 | $329,765 | $128,702 | $201,063 |
| 2020 | $4,235 | $326,384 | $127,382 | $199,002 |
| 2019 | $4,060 | $319,985 | $124,885 | $195,100 |
| 2018 | $4,005 | $313,711 | $122,436 | $191,275 |
| 2017 | $3,935 | $307,560 | $120,035 | $187,525 |
| 2016 | $3,857 | $301,530 | $117,681 | $183,849 |
| 2015 | $3,805 | $297,001 | $115,913 | $181,088 |
| 2014 | $3,700 | $291,184 | $113,643 | $177,541 |
Map
- 163 Saddle Dr
- 2017 Orchard Dr Unit 12
- 101 S Lakeview Ave Unit 101E
- 17887 Mariposa Ave
- 6071 Sun View Rd
- 1718 Truman Cir
- 6000 Highland Ave
- 1667 Oak St
- 1663 Oak St
- 1664 Oak St
- 6082 Candle Light Ln
- 17792 Seminole Way
- 17722 Seminole Way
- 1712 N Glenview Ave
- 1624 La Paloma Ave
- 1617 Sierra Vista Ave
- 1619 Hayes Ct
- 1537 E Spruce St Unit A
- 1578 Topeka Ave Unit 2
- 1562 Topeka Ave Unit 1
- 1942 Harrison Ct
- 1936 Harrison Ct
- 1948 Harrison Ct
- 1945 Tyler Ct
- 1939 Tyler Ct
- 1930 Harrison Ct
- 1943 Harrison Ct
- 1933 Tyler Ct
- 1937 Harrison Ct
- 1924 Harrison Ct
- 1931 Harrison Ct
- 1951 Tyler Ct
- 1927 Tyler Ct
- 1925 Harrison Ct
- 1918 Harrison Ct
- 1921 Tyler Ct
- 1919 Harrison Ct
- 1940 Tyler Ct
- 1934 Tyler Ct
- 1912 Harrison Ct
Ask me questions while you tour the home.