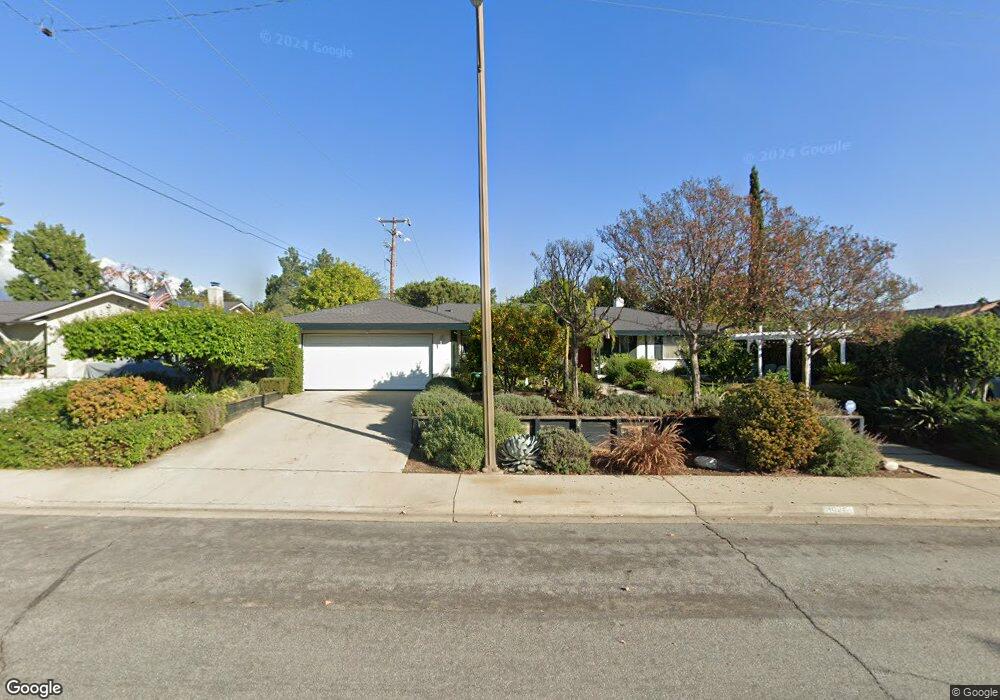
1946 Wheaton Ave Claremont, CA 91711
Condit NeighborhoodEstimated Value: $796,000 - $1,040,000
4
Beds
2
Baths
1,911
Sq Ft
$486/Sq Ft
Est. Value
About This Home
This home is located at 1946 Wheaton Ave, Claremont, CA 91711 and is currently estimated at $929,096, approximately $486 per square foot. 1946 Wheaton Ave is a home located in Los Angeles County with nearby schools including Condit Elementary School, El Roble Intermediate School, and Claremont High School.
Ownership History
Date
Name
Owned For
Owner Type
Purchase Details
Closed on
Jul 16, 2025
Sold by
Abeysekera Manjusri and Abeysekera Nilushi
Bought by
Church Jessica A and Church Luke D
Current Estimated Value
Home Financials for this Owner
Home Financials are based on the most recent Mortgage that was taken out on this home.
Original Mortgage
$680,000
Interest Rate
6.72%
Mortgage Type
New Conventional
Purchase Details
Closed on
Jul 15, 2025
Sold by
Abeysekera Manjursi
Bought by
Abeysekera Manjursri and Abeysekera Nilushi
Home Financials for this Owner
Home Financials are based on the most recent Mortgage that was taken out on this home.
Original Mortgage
$680,000
Interest Rate
6.72%
Mortgage Type
New Conventional
Purchase Details
Closed on
Jun 5, 2001
Sold by
Yang Chung Chien
Bought by
Abeysekera Manjusri
Home Financials for this Owner
Home Financials are based on the most recent Mortgage that was taken out on this home.
Original Mortgage
$190,000
Interest Rate
7.14%
Create a Home Valuation Report for This Property
The Home Valuation Report is an in-depth analysis detailing your home's value as well as a comparison with similar homes in the area
Home Values in the Area
Average Home Value in this Area
Purchase History
| Date | Buyer | Sale Price | Title Company |
|---|---|---|---|
| Church Jessica A | $800,000 | Lawyers Title Company | |
| Abeysekera Manjursri | -- | Lawyers Title Company | |
| Abeysekera Manjusri | $238,500 | Old Republic Title Company |
Source: Public Records
Mortgage History
| Date | Status | Borrower | Loan Amount |
|---|---|---|---|
| Previous Owner | Church Jessica A | $680,000 | |
| Previous Owner | Abeysekera Manjusri | $190,000 |
Source: Public Records
Tax History Compared to Growth
Tax History
| Year | Tax Paid | Tax Assessment Tax Assessment Total Assessment is a certain percentage of the fair market value that is determined by local assessors to be the total taxable value of land and additions on the property. | Land | Improvement |
|---|---|---|---|---|
| 2025 | $4,795 | $358,908 | $234,907 | $124,001 |
| 2024 | $4,795 | $351,871 | $230,301 | $121,570 |
| 2023 | $4,694 | $344,973 | $225,786 | $119,187 |
| 2022 | $4,613 | $338,209 | $221,359 | $116,850 |
| 2021 | $4,528 | $331,578 | $217,019 | $114,559 |
| 2019 | $4,328 | $321,745 | $210,583 | $111,162 |
| 2018 | $4,178 | $315,437 | $206,454 | $108,983 |
| 2016 | $3,892 | $303,190 | $198,438 | $104,752 |
| 2015 | $3,837 | $298,637 | $195,458 | $103,179 |
| 2014 | $3,813 | $292,788 | $191,630 | $101,158 |
Source: Public Records
Map
Nearby Homes
- 1166 Newberry Ln Unit 1
- 631 Gayville Dr
- 872 Knox Place
- 1736 Sumner Ave
- 767 Huron Place
- 753 Huron Place
- 1566 Finecroft Dr
- 1530 Finecroft Dr
- 1585 Mural Dr
- 4215 La Junta Dr
- 1521 Mural Dr
- 556 Boulder Cir
- 1359 Cedarview Dr
- 2105 Oxford Ave
- 1068 Richmond Dr
- 497 Fort Lewis Dr
- 3611 Towne Park Cir
- 944 Richmond Dr
- 1458 N Mountain Ave
- 175 Arlington Dr
- 1938 Wheaton Ave
- 1954 Wheaton Ave
- 1947 Chapman Rd
- 1939 Chapman Rd
- 1955 Chapman Rd
- 1930 Wheaton Ave
- 1962 Wheaton Ave
- 1945 Wheaton Ave
- 1953 Wheaton Ave
- 1931 Chapman Rd
- 1937 Wheaton Ave
- 1963 Chapman Rd
- 1922 Wheaton Ave
- 1929 Wheaton Ave
- 1970 Wheaton Ave
- 1961 Wheaton Ave
- 1923 Chapman Rd
- 1969 Wheaton Ave
- 1041 Occidental Dr
- 1948 Chapman Rd