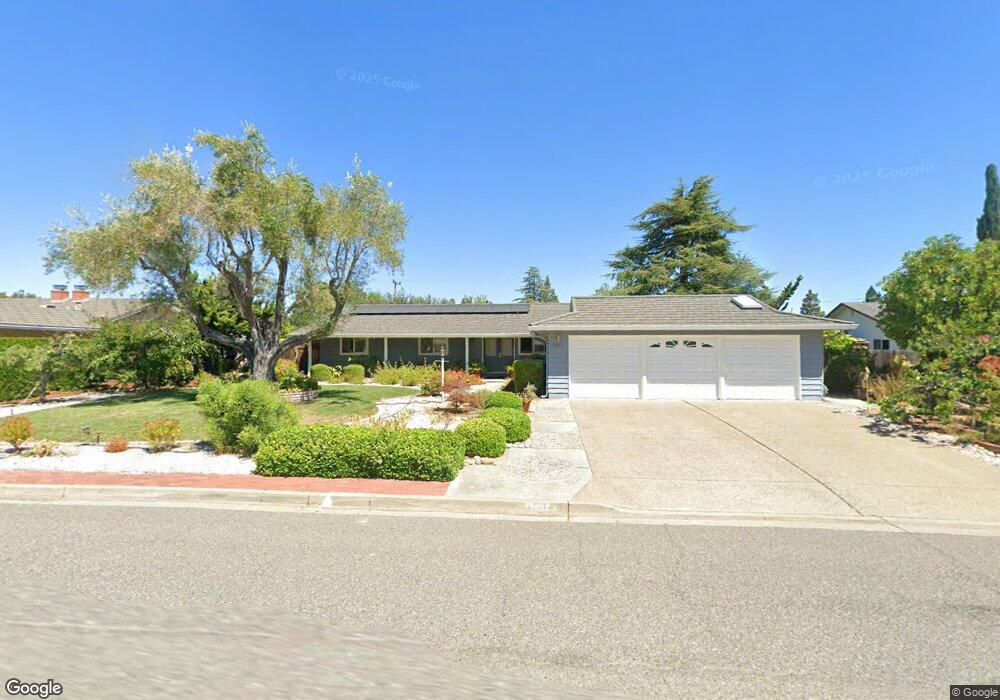
19467 Northampton Dr Saratoga, CA 95070
West San Jose NeighborhoodEstimated Value: $3,826,000 - $4,194,000
4
Beds
3
Baths
1,999
Sq Ft
$1,974/Sq Ft
Est. Value
About This Home
This home is located at 19467 Northampton Dr, Saratoga, CA 95070 and is currently estimated at $3,946,986, approximately $1,974 per square foot. 19467 Northampton Dr is a home located in Santa Clara County with nearby schools including Blue Hills Elementary School, Joaquin Miller Middle, and Lynbrook High School.
Ownership History
Date
Name
Owned For
Owner Type
Purchase Details
Closed on
Jun 26, 2014
Sold by
Pei Hui and Pei Zhihong Barbara Qiu
Bought by
The Pei Family Trust and Qiu Pei Zhihong Barbara
Current Estimated Value
Purchase Details
Closed on
Dec 18, 2007
Sold by
Pei Zhihong Barbara Qiu and Pei Hui
Bought by
Pei Zhihong Barbara Qiu and Pei Hui
Home Financials for this Owner
Home Financials are based on the most recent Mortgage that was taken out on this home.
Original Mortgage
$900,000
Outstanding Balance
$558,770
Interest Rate
6.02%
Mortgage Type
Purchase Money Mortgage
Estimated Equity
$3,388,216
Purchase Details
Closed on
Nov 8, 2007
Sold by
Holzmer William J
Bought by
Sutton Zhihong Q and Pei Hui
Home Financials for this Owner
Home Financials are based on the most recent Mortgage that was taken out on this home.
Original Mortgage
$900,000
Outstanding Balance
$558,770
Interest Rate
6.02%
Mortgage Type
Purchase Money Mortgage
Estimated Equity
$3,388,216
Create a Home Valuation Report for This Property
The Home Valuation Report is an in-depth analysis detailing your home's value as well as a comparison with similar homes in the area
Home Values in the Area
Average Home Value in this Area
Purchase History
| Date | Buyer | Sale Price | Title Company |
|---|---|---|---|
| The Pei Family Trust | -- | None Available | |
| Pei Zhihong Barbara Qiu | -- | None Available | |
| Sutton Zhihong Q | $1,505,000 | Stewart Title Sc Title |
Source: Public Records
Mortgage History
| Date | Status | Borrower | Loan Amount |
|---|---|---|---|
| Open | Sutton Zhihong Q | $900,000 |
Source: Public Records
Tax History Compared to Growth
Tax History
| Year | Tax Paid | Tax Assessment Tax Assessment Total Assessment is a certain percentage of the fair market value that is determined by local assessors to be the total taxable value of land and additions on the property. | Land | Improvement |
|---|---|---|---|---|
| 2025 | $23,458 | $1,976,831 | $1,482,561 | $494,270 |
| 2024 | $23,458 | $1,938,071 | $1,453,492 | $484,579 |
| 2023 | $23,265 | $1,900,071 | $1,424,993 | $475,078 |
| 2022 | $23,044 | $1,862,815 | $1,397,052 | $465,763 |
| 2021 | $22,796 | $1,826,290 | $1,369,659 | $456,631 |
| 2020 | $22,508 | $1,807,564 | $1,355,615 | $451,949 |
| 2019 | $21,974 | $1,772,123 | $1,329,035 | $443,088 |
| 2018 | $21,448 | $1,737,376 | $1,302,976 | $434,400 |
| 2017 | $21,335 | $1,703,311 | $1,277,428 | $425,883 |
| 2016 | $20,650 | $1,669,914 | $1,252,381 | $417,533 |
| 2015 | $20,491 | $1,644,832 | $1,233,570 | $411,262 |
| 2014 | $19,960 | $1,612,613 | $1,209,407 | $403,206 |
Source: Public Records
Map
Nearby Homes
- 1681 Danromas Way
- 12140 Woodside Dr
- 1587 Miller Ave
- 19920 Viewridge Dr
- 13010 Glen Brae Dr
- 19437 Via Real Dr
- 12790 Glen Arbor Ct
- 19423 Vineyard Ln
- 19662 Via Grande Dr
- 19113 Vineyard Ln
- 11010 Maple Place Unit 25-06 Plan 4
- 10750 Elm Cir Unit 88-17 Plan 2
- 10730 Elm Cir Unit 86-17 Plan 2
- 11315 Cottonwood Place Unit 39-09 Plan 3
- Plan 2 at The Elms
- Plan 3 at The Elms
- Plan 4 at The Elms
- 11645 Redwood Place Unit 56-12 Plan 4
- 5635 W Walbrook Dr
- 11210 Cottonwood Place Unit 35-08 Plan 4
- 19489 Northampton Dr
- 19445 Northampton Dr
- 19466 Miller Ct
- 19478 Miller Ct
- 19388 Miller Ct
- 19468 Northampton Dr
- 19501 Northampton Dr Unit 3
- 19446 Northampton Dr
- 19490 Northampton Dr
- 19490 Miller Ct
- 19523 Northampton Dr
- 19502 Northampton Dr
- 12474 Miller Ave
- 19502 Miller Ct
- 12502 Miller Ave
- 19445 Dorchester Dr
- 19467 Dorchester Dr
- 19443 Miller Ct
- 19465 Miller Ct
- 12452 Miller Ave