1947 Francisco St Unit 1947 Berkeley, CA 94709
North Berkeley NeighborhoodEstimated Value: $581,000 - $856,000
About This Home
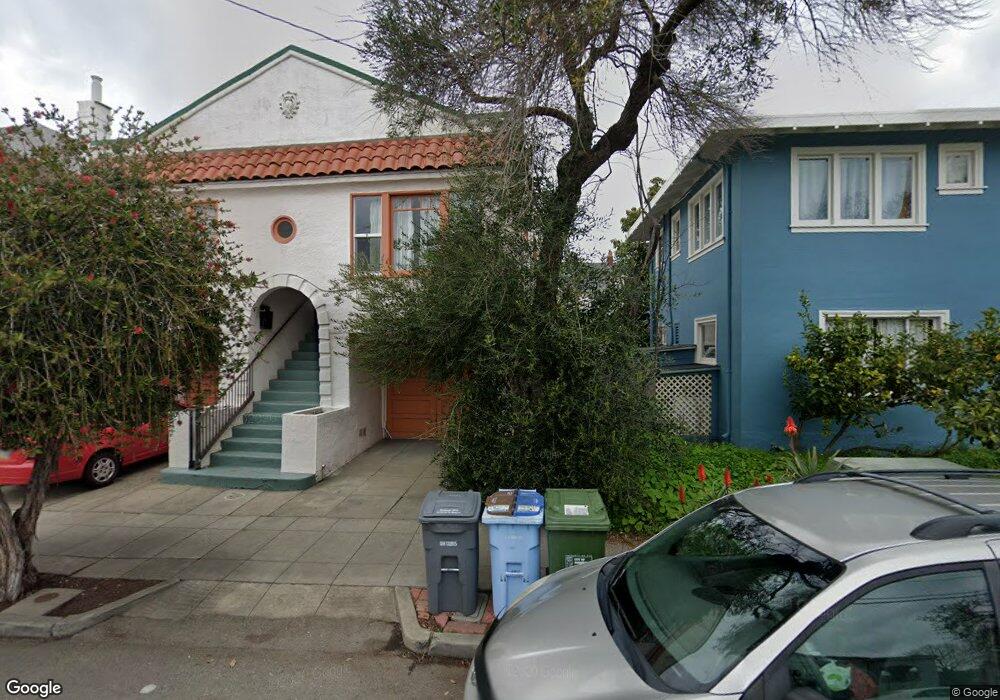
This home is located at 1947 Francisco St Unit 1947, Berkeley, CA 94709 and is currently estimated at $708,986, approximately $805 per square foot. 1947 Francisco St Unit 1947 is a home located in Alameda County with nearby schools including Berkeley Arts Magnet at Whittier School, Washington Elementary School, and Oxford Elementary School.
Ownership History
We collect this data history from publicly available records. To have your information removed, we recommend requesting removal directly through your county’s website.
Purchase Details
Home Financials for this Owner
Home Financials are based on the most recent Mortgage that was taken out on this home.Purchase Details
Purchase Details
Home Financials for this Owner
Home Financials are based on the most recent Mortgage that was taken out on this home.Purchase Details
Home Values in the Area
Average Home Value in this Area
Purchase History
We collect this data history from publicly available records. To have your information removed, we recommend requesting removal directly through your county’s website.
| Date | Buyer | Sale Price | Title Company |
|---|---|---|---|
| -- | Chicago Title | ||
| -- | Chicago Title | ||
| -- | None Available | ||
| $176,000 | Placer Title Company | ||
| -- | -- |
Mortgage History
We collect this data history from publicly available records. To have your information removed, we recommend requesting removal directly through your county’s website.
| Date | Status | Borrower | Loan Amount |
|---|---|---|---|
| Open | $292,000 | ||
| Previous Owner | $351,000 |
Tax History
We collect this data history from publicly available records. To have your information removed, we recommend requesting removal directly through your county’s website.
| Year | Tax Paid | Tax Assessment Tax Assessment Total Assessment is a certain percentage of the fair market value that is determined by local assessors to be the total taxable value of land and additions on the property. | Land | Improvement |
|---|---|---|---|---|
| 2025 | $9,441 | $569,371 | $170,811 | $398,560 |
| 2024 | $9,441 | $558,208 | $167,462 | $390,746 |
| 2023 | $9,237 | $547,267 | $164,180 | $383,087 |
| 2022 | $9,056 | $536,538 | $160,961 | $375,577 |
| 2021 | $9,067 | $526,021 | $157,806 | $368,215 |
| 2020 | $8,542 | $520,628 | $156,188 | $364,440 |
| 2019 | $8,164 | $510,424 | $153,127 | $357,297 |
| 2018 | $8,019 | $500,418 | $150,125 | $350,293 |
| 2017 | $7,734 | $490,608 | $147,182 | $343,426 |
| 2016 | $7,456 | $480,988 | $144,296 | $336,692 |
| 2015 | $7,353 | $473,767 | $142,130 | $331,637 |
| 2014 | $7,292 | $464,490 | $139,347 | $325,143 |
Map
- 2015 Hearst Ave
- 1906 Delaware St
- 1609 Bonita Ave Unit 5
- 1682 Oxford St
- 1734 Spruce St
- 1841 Vine St
- 1739 Spruce St
- 1837 Addison St
- 1425 Martin Luther King jr Way
- 1444 Walnut St
- 1408 Henry St
- 1429 Edith St
- 2301 Virginia St Unit 1
- 2112 Mckinley Ave Unit D
- 2340 Virginia St
- 1744 Addison St
- 1616 Francisco St
- 1732 University Ave
- 2378 Virginia St
- 2218 -2222 Grant St
- 1712 Milvia St
- 1716 Milvia St
- 1945 Francisco St
- 1710 Milvia St
- 1939 Francisco St
- 1708 Milvia St
- 2001 Francisco St
- 1937 Francisco St
- 1713 Milvia St
- 2005 Francisco St
- 1711 Milvia St Unit A
- 1711 Milvia St Unit B
- 1728 Milvia St
- 1933 Francisco St
- 1709 Milvia St Unit 1
- 1705 Milvia St
- 2009 Francisco St
- 1729 Milvia St
- 1940 Francisco St
- 1730 Milvia St
Ask me questions while you tour the home.