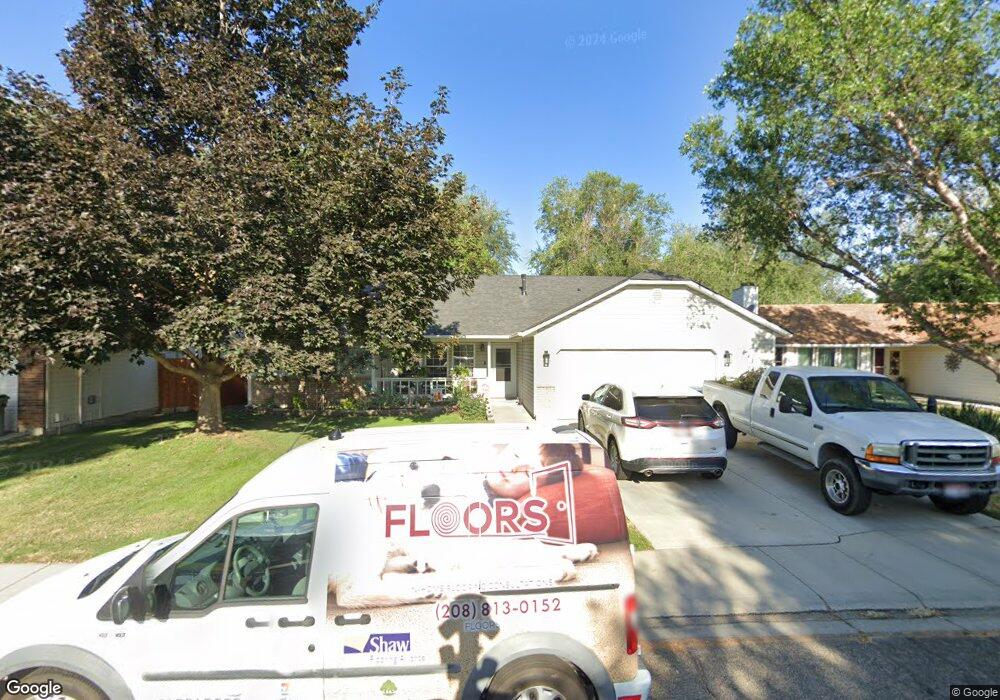
1947 N Carissa Ave Boise, ID 83704
West Boise NeighborhoodEstimated Value: $451,000 - $488,000
3
Beds
2
Baths
1,800
Sq Ft
$258/Sq Ft
Est. Value
About This Home
This home is located at 1947 N Carissa Ave, Boise, ID 83704 and is currently estimated at $465,296, approximately $258 per square foot. 1947 N Carissa Ave is a home located in Ada County with nearby schools including Morley Nelson Elementary School, Fairmont Junior High School, and Capital High School.
Ownership History
Date
Name
Owned For
Owner Type
Purchase Details
Closed on
Mar 14, 2022
Sold by
Howell James A
Bought by
Gibson Thomas A and Gibson Cynthia D
Current Estimated Value
Home Financials for this Owner
Home Financials are based on the most recent Mortgage that was taken out on this home.
Original Mortgage
$418,500
Outstanding Balance
$390,704
Interest Rate
3.85%
Mortgage Type
Balloon
Estimated Equity
$74,592
Purchase Details
Closed on
Dec 17, 2018
Sold by
Tuggle Carolyn
Bought by
Howell James A
Purchase Details
Closed on
Jan 18, 2013
Sold by
Howell James A
Bought by
Tuggle Carolyn
Purchase Details
Closed on
Aug 11, 2010
Sold by
Howell James A and Tuggle Carolyn B
Bought by
Howell James A
Purchase Details
Closed on
Apr 2, 2008
Sold by
Tuggle Carolyn B
Bought by
Tuggle Carolyn B and Howell James A
Purchase Details
Closed on
Feb 25, 2008
Sold by
Howell James A
Bought by
Tuggle Carolyn B
Create a Home Valuation Report for This Property
The Home Valuation Report is an in-depth analysis detailing your home's value as well as a comparison with similar homes in the area
Home Values in the Area
Average Home Value in this Area
Purchase History
| Date | Buyer | Sale Price | Title Company |
|---|---|---|---|
| Gibson Thomas A | -- | Alliance Title | |
| Howell James A | -- | None Available | |
| Tuggle Carolyn | -- | None Available | |
| Howell James A | -- | None Available | |
| Tuggle Carolyn B | -- | None Available | |
| Tuggle Carolyn B | -- | Alliance Title |
Source: Public Records
Mortgage History
| Date | Status | Borrower | Loan Amount |
|---|---|---|---|
| Open | Gibson Thomas A | $418,500 |
Source: Public Records
Tax History Compared to Growth
Tax History
| Year | Tax Paid | Tax Assessment Tax Assessment Total Assessment is a certain percentage of the fair market value that is determined by local assessors to be the total taxable value of land and additions on the property. | Land | Improvement |
|---|---|---|---|---|
| 2025 | $2,604 | $426,300 | -- | -- |
| 2024 | $2,349 | $411,800 | -- | -- |
| 2023 | $2,349 | $371,000 | $0 | $0 |
| 2022 | $2,871 | $456,000 | $0 | $0 |
| 2021 | $2,600 | $362,800 | $0 | $0 |
| 2020 | $2,237 | $288,300 | $0 | $0 |
| 2019 | $2,397 | $276,600 | $0 | $0 |
| 2018 | $1,955 | $228,700 | $0 | $0 |
| 2017 | $1,527 | $191,000 | $0 | $0 |
| 2016 | $1,473 | $179,800 | $0 | $0 |
| 2015 | $1,434 | $169,800 | $0 | $0 |
| 2012 | -- | $141,700 | $0 | $0 |
Source: Public Records
Map
Nearby Homes
- 9936 W Holt St
- 10163 W Holt St
- 9809 W Lupine St
- 1951 N Hampton Rd Unit B6
- 2223 N Iris Place
- 2035 N Patricia Ave
- 2300 N Iris Ln
- 1321 N Gawaine Place
- 9436 W Glen Ellyn Ln
- 2392 N Patricia Ln
- 2711 N Pilgrim Ln
- 9718 W Macaw St
- 10369 W Florence Ln
- 2573 & 2575 N Dusty Ln
- 10014 Dewitt Ln
- 2791 N Siesta Ln
- 10319 W Ardyce St
- 10838 W Tidewater Ct
- 1098 N Carmen Ave
- 9632 W De Witt St
- 1921 N Carissa Ave
- 1965 N Carissa Ave
- 1899 N Carissa Ave
- 1936 N Ancestor Ave
- 1920 N Ancestor Ave
- 9972 W Holt St
- 1922 N Carissa Ave
- 1890 N Ancestor Ave
- 9954 W Holt St
- 1875 N Carissa Ave
- 1904 N Carissa Ave
- 1903/1905 N Ancestor Ave
- 1885/1887 N Ancestor Ave
- 1876 N Carissa Ave
- 9907 W Holt St
- 1854 Ancestor Ave
- 1857 N Carissa Ave
- TBD N Ancestor Ave
- 1967 N Ancestor Ave
- 9918 W Holt St