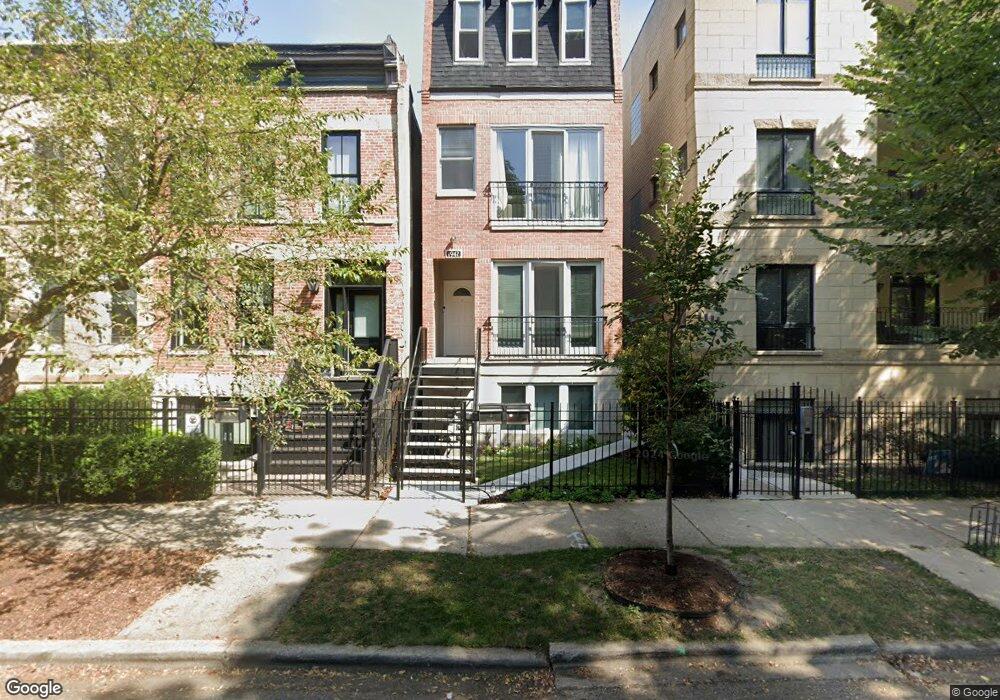
1947 N Wilmot Ave Unit 1 Chicago, IL 60647
Bucktown NeighborhoodEstimated Value: $651,000 - $791,000
3
Beds
2
Baths
1,600
Sq Ft
$444/Sq Ft
Est. Value
About This Home
This home is located at 1947 N Wilmot Ave Unit 1, Chicago, IL 60647 and is currently estimated at $709,682, approximately $443 per square foot. 1947 N Wilmot Ave Unit 1 is a home located in Cook County with nearby schools including Pulaski Intl School of Chicago, Clemente Community Academy High School, and CICS - Bucktown Campus.
Ownership History
Date
Name
Owned For
Owner Type
Purchase Details
Closed on
Sep 10, 2001
Sold by
Davis Kelly A
Bought by
Davis Kelly A and Kelly A Davis Trust
Current Estimated Value
Purchase Details
Closed on
Dec 21, 2000
Sold by
Davis Kelly A
Bought by
Davis Kelly A and The Kelly A Davis Trust
Purchase Details
Closed on
Apr 13, 2000
Sold by
Walczak Renata and The Renata Walczak Trust
Bought by
Davis Kelly A
Home Financials for this Owner
Home Financials are based on the most recent Mortgage that was taken out on this home.
Original Mortgage
$219,900
Interest Rate
8.18%
Create a Home Valuation Report for This Property
The Home Valuation Report is an in-depth analysis detailing your home's value as well as a comparison with similar homes in the area
Home Values in the Area
Average Home Value in this Area
Purchase History
| Date | Buyer | Sale Price | Title Company |
|---|---|---|---|
| Davis Kelly A | -- | -- | |
| Davis Kelly A | -- | -- | |
| Davis Kelly A | $249,000 | -- |
Source: Public Records
Mortgage History
| Date | Status | Borrower | Loan Amount |
|---|---|---|---|
| Previous Owner | Davis Kelly A | $219,900 |
Source: Public Records
Tax History Compared to Growth
Tax History
| Year | Tax Paid | Tax Assessment Tax Assessment Total Assessment is a certain percentage of the fair market value that is determined by local assessors to be the total taxable value of land and additions on the property. | Land | Improvement |
|---|---|---|---|---|
| 2024 | $11,324 | $42,912 | $7,830 | $35,082 |
| 2023 | $11,016 | $56,795 | $4,095 | $52,700 |
| 2022 | $11,016 | $56,795 | $4,095 | $52,700 |
| 2021 | $10,786 | $56,794 | $4,095 | $52,699 |
| 2020 | $8,735 | $42,173 | $4,095 | $38,078 |
| 2019 | $8,584 | $45,999 | $4,095 | $41,904 |
| 2018 | $8,408 | $45,999 | $4,095 | $41,904 |
| 2017 | $7,341 | $37,476 | $3,600 | $33,876 |
| 2016 | $7,006 | $37,476 | $3,600 | $33,876 |
| 2015 | $6,387 | $37,476 | $3,600 | $33,876 |
| 2014 | $5,191 | $30,546 | $3,195 | $27,351 |
| 2013 | $5,077 | $30,546 | $3,195 | $27,351 |
Source: Public Records
Map
Nearby Homes
- 1916 N Wilmot Ave
- 2011 N Oakley Ave
- 2236 W Armitage Ave Unit 303
- 2014 N Western Ave
- 1865 N Winnebago Ave Unit 4S
- 2340 W Moffat St
- 1832 N Wilmot Ave Unit A
- 2418 W Moffat St Unit 1
- 1825 N Winnebago Ave Unit 302
- 1835 N Milwaukee Ave Unit 301
- 2300 W Bloomingdale Ave Unit P-3
- 2300 W Bloomingdale Ave Unit P-4
- 2451 W Cortland St Unit 3
- 2423 W Moffat St
- 1867 N Leavitt St
- 2418 W Bloomingdale Ave Unit C2
- 2135 W Armitage Ave
- 2320 W St Paul Ave Unit 201
- 2310 W St Paul Ave Unit 601
- 2310 W Saint Paul Ave Unit PB-4A
- 1947 N Wilmot Ave
- 1947 N Wilmot Ave Unit 2
- 1947 N Wilmot Ave Unit G2
- 1947 N Wilmot Ave Unit 2
- 1947 N Wilmot Ave Unit G1
- 1947 N Wilmot Ave Unit 3
- 1947 N Wilmot Ave Unit PENT
- 1949 N Wilmot Ave
- 1945 N Wilmot Ave Unit 1R
- 1945 N Wilmot Ave Unit 1F
- 1945 N Wilmot Ave Unit 2
- 1945 N Wilmot Ave Unit 1
- 1951 N Wilmot Ave
- 1941 N Wilmot Ave
- 1941 N Wilmot Ave Unit 1
- 1941 N Wilmot Ave Unit G
- 1961 N Wilmot Ave Unit 1
- 1961 N Wilmot Ave Unit 2
- 1939 N Wilmot Ave
- 1939 N Wilmot Ave