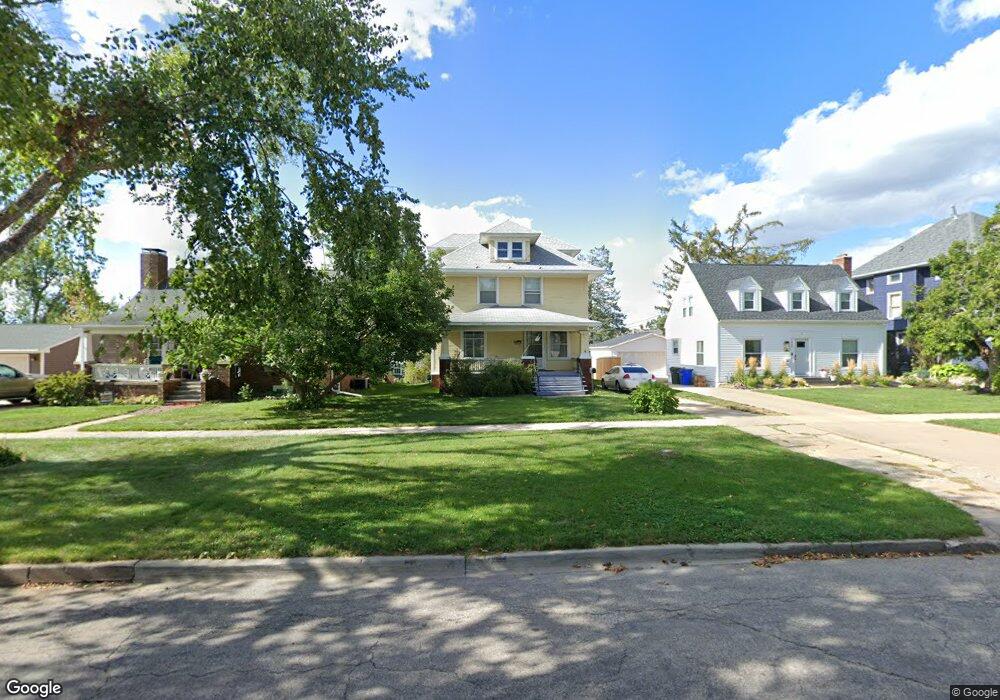
1948 B Ave NE Cedar Rapids, IA 52402
Mound View NeighborhoodEstimated Value: $179,509 - $199,000
3
Beds
3
Baths
1,854
Sq Ft
$103/Sq Ft
Est. Value
About This Home
This home is located at 1948 B Ave NE, Cedar Rapids, IA 52402 and is currently estimated at $190,127, approximately $102 per square foot. 1948 B Ave NE is a home located in Linn County with nearby schools including Arthur Elementary School, Franklin Middle School, and George Washington High School.
Ownership History
Date
Name
Owned For
Owner Type
Purchase Details
Closed on
Jun 11, 2010
Sold by
Estate Of Gerald S May
Bought by
May Jeffrey E
Current Estimated Value
Create a Home Valuation Report for This Property
The Home Valuation Report is an in-depth analysis detailing your home's value as well as a comparison with similar homes in the area
Home Values in the Area
Average Home Value in this Area
Purchase History
| Date | Buyer | Sale Price | Title Company |
|---|---|---|---|
| May Jeffrey E | -- | None Available |
Source: Public Records
Tax History Compared to Growth
Tax History
| Year | Tax Paid | Tax Assessment Tax Assessment Total Assessment is a certain percentage of the fair market value that is determined by local assessors to be the total taxable value of land and additions on the property. | Land | Improvement |
|---|---|---|---|---|
| 2025 | $2,486 | $166,700 | $37,000 | $129,700 |
| 2024 | $2,938 | $151,000 | $34,400 | $116,600 |
| 2023 | $2,938 | $151,000 | $34,400 | $116,600 |
| 2022 | $2,796 | $148,200 | $30,600 | $117,600 |
| 2021 | $2,834 | $143,900 | $30,600 | $113,300 |
| 2020 | $2,834 | $137,000 | $25,500 | $111,500 |
| 2019 | $2,670 | $132,400 | $25,500 | $106,900 |
| 2018 | $2,592 | $132,400 | $25,500 | $106,900 |
| 2017 | $2,610 | $128,400 | $25,500 | $102,900 |
| 2016 | $2,555 | $120,200 | $25,500 | $94,700 |
| 2015 | $2,767 | $130,066 | $25,500 | $104,566 |
| 2014 | $2,582 | $136,158 | $25,500 | $110,658 |
| 2013 | $2,650 | $136,158 | $25,500 | $110,658 |
Source: Public Records
Map
Nearby Homes
- 122 20th St NE
- 205 21st St NE
- 1953 1st Ave E Unit 301
- 1953 1st Ave SE Unit 301
- 1953 1st Ave SE Unit 503
- 418 21st St NE
- 306 21st St NE
- 321 22nd St NE
- 1857 E Ave NE
- 1953 2nd Ave SE
- 1815 E Ave NE
- 1746 B Ave NE
- 1748 A Ave NE
- 1831 2nd Ave SE
- 1735 C Ave NE
- 517 18th St NE
- 2222 1st Ave NE Unit 107
- 2222 1st Ave NE
- 2222 1st Ave NE Unit 305
- 2222 1st Ave NE Unit 507