Estimated Value: $130,879 - $150,000
2
Beds
1
Bath
1,040
Sq Ft
$137/Sq Ft
Est. Value
About This Home
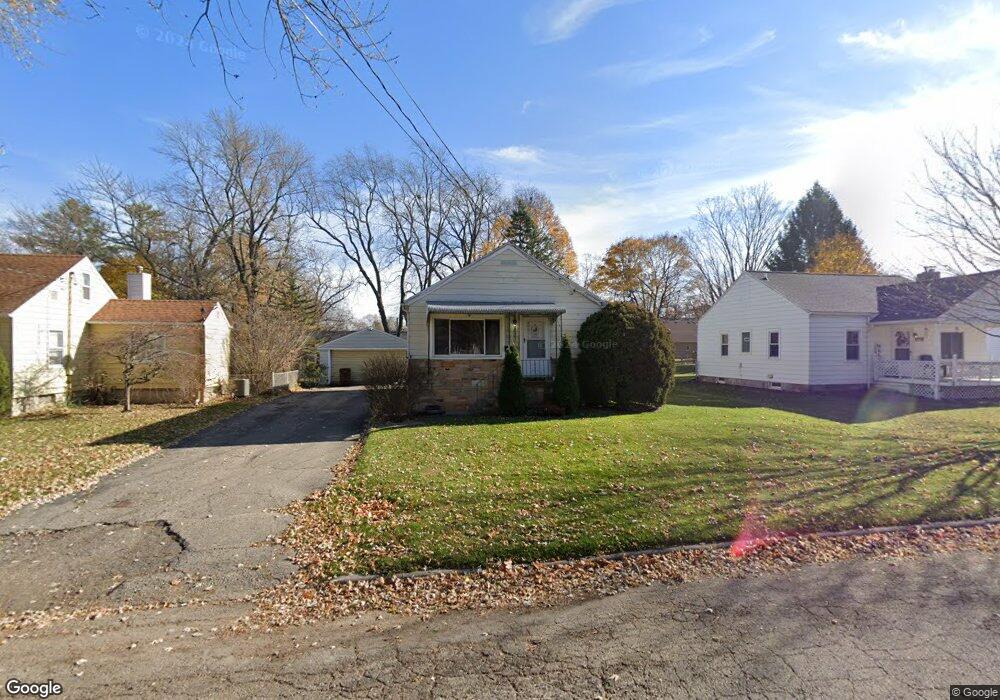
This home is located at 1948 Chestnut St, Holt, MI 48842 and is currently estimated at $142,470, approximately $136 per square foot. 1948 Chestnut St is a home located in Ingham County with nearby schools including Sycamore Elementary School, Hope Middle School, and Holt Junior High School.
Ownership History
Date
Name
Owned For
Owner Type
Purchase Details
Closed on
Jul 31, 2008
Sold by
Rodgers John D and Rodgers Kimberly S
Bought by
Backus Traci L and Backus Michael
Current Estimated Value
Home Financials for this Owner
Home Financials are based on the most recent Mortgage that was taken out on this home.
Original Mortgage
$83,341
Outstanding Balance
$54,860
Interest Rate
6.39%
Mortgage Type
FHA
Estimated Equity
$87,610
Purchase Details
Closed on
Jan 10, 2005
Sold by
Dickey Darline K
Bought by
Rodgers John D
Home Financials for this Owner
Home Financials are based on the most recent Mortgage that was taken out on this home.
Original Mortgage
$109,300
Interest Rate
5.83%
Mortgage Type
VA
Purchase Details
Closed on
Oct 7, 2003
Sold by
Newcomb Inez F and Newcomb Percy W
Bought by
Dickey Darline K and Newcomb Inez
Create a Home Valuation Report for This Property
The Home Valuation Report is an in-depth analysis detailing your home's value as well as a comparison with similar homes in the area
Home Values in the Area
Average Home Value in this Area
Purchase History
| Date | Buyer | Sale Price | Title Company |
|---|---|---|---|
| Backus Traci L | $84,000 | Titleamerica | |
| Rodgers John D | $107,000 | Tnt | |
| Dickey Darline K | -- | -- |
Source: Public Records
Mortgage History
| Date | Status | Borrower | Loan Amount |
|---|---|---|---|
| Open | Backus Traci L | $83,341 | |
| Previous Owner | Rodgers John D | $109,300 |
Source: Public Records
Tax History
| Year | Tax Paid | Tax Assessment Tax Assessment Total Assessment is a certain percentage of the fair market value that is determined by local assessors to be the total taxable value of land and additions on the property. | Land | Improvement |
|---|---|---|---|---|
| 2025 | $2,089 | $56,300 | $24,000 | $32,300 |
| 2024 | $2,593 | $55,800 | $20,800 | $35,000 |
| 2023 | $2,593 | $49,200 | $15,000 | $34,200 |
| 2022 | $1,827 | $44,400 | $15,000 | $29,400 |
| 2021 | $1,792 | $41,200 | $11,500 | $29,700 |
| 2020 | $1,844 | $39,000 | $11,500 | $27,500 |
| 2019 | $1,875 | $37,400 | $10,500 | $26,900 |
| 2018 | $1,865 | $34,200 | $10,500 | $23,700 |
| 2017 | $1,686 | $34,200 | $10,500 | $23,700 |
| 2016 | $1,612 | $33,700 | $10,100 | $23,600 |
| 2015 | $1,584 | $32,000 | $20,122 | $11,878 |
| 2014 | $1,584 | $31,200 | $20,122 | $11,078 |
Source: Public Records
Map
Nearby Homes
- 1942 Walnut St
- 1920 Schoolcraft St
- 1905 Walnut St
- 4360 Holt Rd Unit 9
- 4282 Woodworth Ave
- 2122 Cedar St
- 1761 Schoolcraft St
- 4108 Holt Rd
- 0 Aurelius Rd Unit 282659
- 2201 Bertha St
- 4327 Keller Rd
- 1959 Adelpha Ave
- 4592 Holt Rd
- 1545 Thimbleberry Ln
- 4376 Davlind Dr
- 4641 Tolland Ave
- 4662 Tolland Ave
- 2345 N Cedar St
- 2245 Main St
- 2414 Pine Tree Rd
Your Personal Tour Guide
Ask me questions while you tour the home.