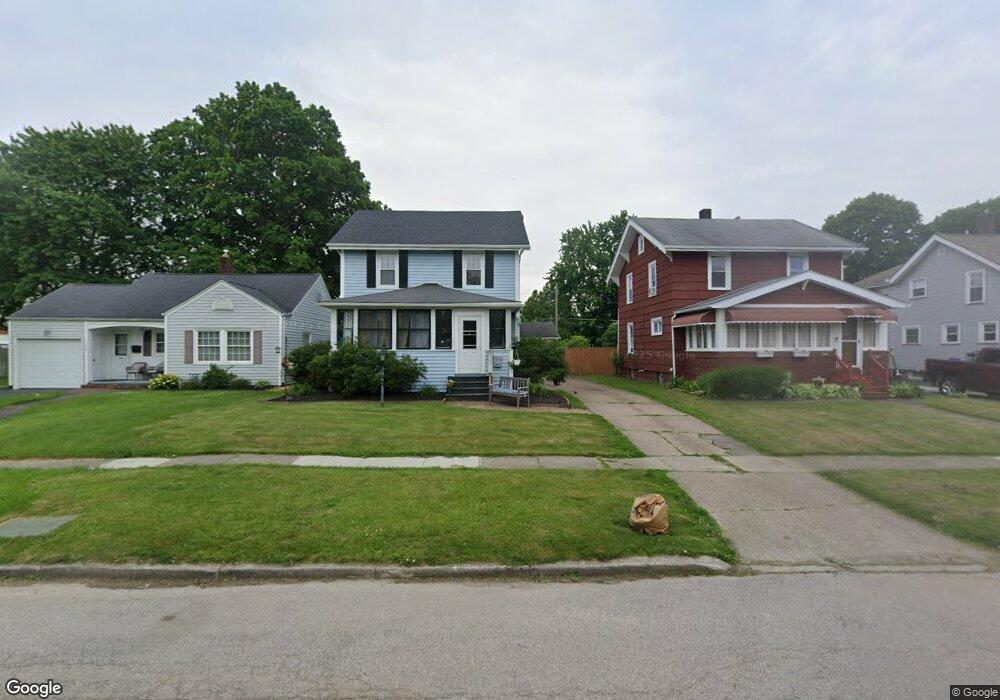
1948 E 45th St Ashtabula, OH 44004
Estimated Value: $164,232 - $208,000
4
Beds
2
Baths
1,908
Sq Ft
$99/Sq Ft
Est. Value
About This Home
This home is located at 1948 E 45th St, Ashtabula, OH 44004 and is currently estimated at $188,308, approximately $98 per square foot. 1948 E 45th St is a home located in Ashtabula County with nearby schools including Lakeside High School and Christian Faith Academy.
Ownership History
Date
Name
Owned For
Owner Type
Purchase Details
Closed on
Oct 23, 2024
Sold by
Boardwine Jeffery A and Boardwine Crystal M
Bought by
Boardwine Crystal M
Current Estimated Value
Home Financials for this Owner
Home Financials are based on the most recent Mortgage that was taken out on this home.
Original Mortgage
$142,450
Interest Rate
6.65%
Mortgage Type
FHA
Purchase Details
Closed on
May 10, 2005
Sold by
Melaragno Barbara T
Bought by
Boardwine Jeffrey A and Boardwine Crystal M
Home Financials for this Owner
Home Financials are based on the most recent Mortgage that was taken out on this home.
Original Mortgage
$116,725
Interest Rate
6.13%
Mortgage Type
FHA
Create a Home Valuation Report for This Property
The Home Valuation Report is an in-depth analysis detailing your home's value as well as a comparison with similar homes in the area
Home Values in the Area
Average Home Value in this Area
Purchase History
| Date | Buyer | Sale Price | Title Company |
|---|---|---|---|
| Boardwine Crystal M | -- | First Title & Escrow Inc | |
| Boardwine Crystal M | -- | First Title & Escrow Inc | |
| Boardwine Jeffrey A | $120,000 | Main Street Title |
Source: Public Records
Mortgage History
| Date | Status | Borrower | Loan Amount |
|---|---|---|---|
| Previous Owner | Boardwine Crystal M | $142,450 | |
| Previous Owner | Boardwine Jeffrey A | $116,725 |
Source: Public Records
Tax History
| Year | Tax Paid | Tax Assessment Tax Assessment Total Assessment is a certain percentage of the fair market value that is determined by local assessors to be the total taxable value of land and additions on the property. | Land | Improvement |
|---|---|---|---|---|
| 2024 | $3,783 | $44,030 | $4,830 | $39,200 |
| 2023 | $2,168 | $44,030 | $4,830 | $39,200 |
| 2022 | $1,787 | $31,710 | $3,710 | $28,000 |
| 2021 | $1,792 | $31,710 | $3,710 | $28,000 |
| 2020 | $1,819 | $31,710 | $3,710 | $28,000 |
| 2019 | $1,608 | $26,540 | $4,100 | $22,440 |
| 2018 | $1,455 | $26,540 | $4,100 | $22,440 |
| 2017 | $1,392 | $26,540 | $4,100 | $22,440 |
| 2016 | $1,369 | $23,910 | $3,710 | $20,200 |
| 2015 | $1,332 | $23,910 | $3,710 | $20,200 |
| 2014 | $1,294 | $23,910 | $3,710 | $20,200 |
| 2013 | $1,746 | $34,900 | $2,030 | $32,870 |
Source: Public Records
Map
Nearby Homes
- 4422 State Rd
- 4422 Rodgers Rd
- 2130 E 44th St
- 4320 Birchwood Ave
- 1629 E 47th St
- 4016 State Rd
- 2124 E 40th St
- 1930 E 52nd St
- 183 1626 E 51st St
- 1626 #165 E 51st St
- 1626 132 E 51st St
- 5031 Blakeslee Ave
- 4211 Park Ave
- 2930 S Ridge Rd E
- 137 Grove Dr
- 3603 Silvieus Dr
- 4125 Station Ave
- 3129 Lincoln Dr
- 3835 Lake Ave
- 3829 Lake Ave
Your Personal Tour Guide
Ask me questions while you tour the home.