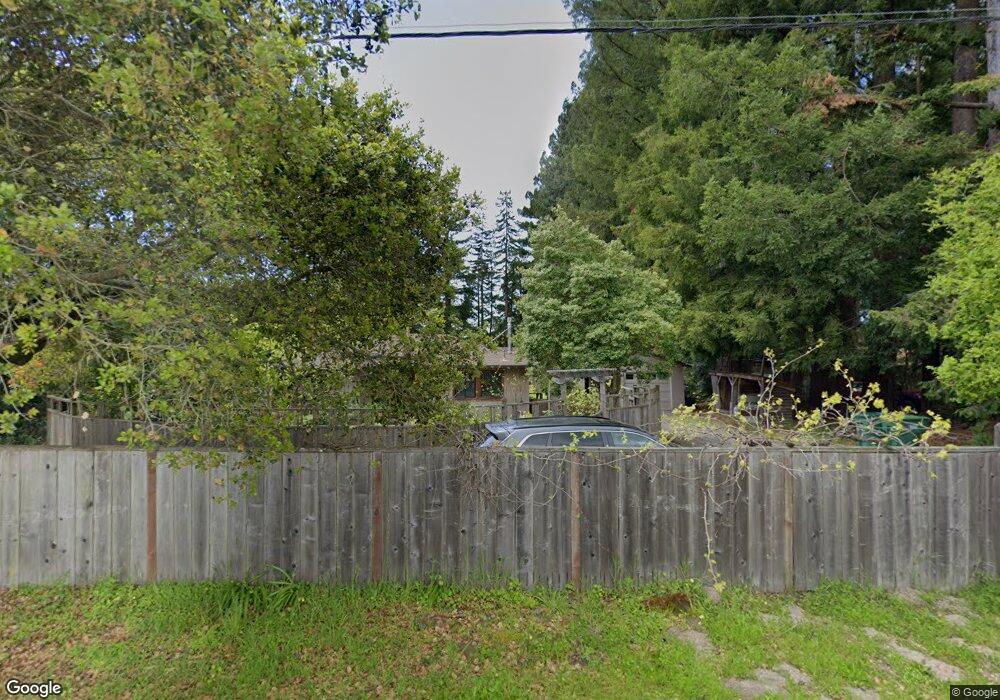
1948 Pleasant Hill Rd Sebastopol, CA 95472
Estimated Value: $801,596 - $1,268,000
2
Beds
1
Bath
1,200
Sq Ft
$864/Sq Ft
Est. Value
About This Home
This home is located at 1948 Pleasant Hill Rd, Sebastopol, CA 95472 and is currently estimated at $1,037,399, approximately $864 per square foot. 1948 Pleasant Hill Rd is a home located in Sonoma County with nearby schools including Apple Blossom School, Analy High School, and Sunridge Charter School.
Ownership History
Date
Name
Owned For
Owner Type
Purchase Details
Closed on
Dec 29, 2014
Sold by
Rice Mark E
Bought by
Rice Mark E
Current Estimated Value
Purchase Details
Closed on
Sep 28, 2011
Sold by
Dietel P Aline
Bought by
Rice Mark E
Purchase Details
Closed on
Jun 20, 2001
Sold by
Rice Raymond H and Rice Lili R
Bought by
Rice Mark E and Rice Aline Dietel
Home Financials for this Owner
Home Financials are based on the most recent Mortgage that was taken out on this home.
Original Mortgage
$165,000
Outstanding Balance
$62,852
Interest Rate
7.14%
Estimated Equity
$974,547
Purchase Details
Closed on
Jan 16, 1996
Sold by
Rice Mark E and Rice Aline Dietel
Bought by
Rice Mark E and Rice Aline Dietel
Home Financials for this Owner
Home Financials are based on the most recent Mortgage that was taken out on this home.
Original Mortgage
$75,000
Interest Rate
7.18%
Purchase Details
Closed on
Dec 30, 1993
Sold by
Rice Raymond and Rice Lili
Bought by
Rice Mark E and Aline Dietel P
Create a Home Valuation Report for This Property
The Home Valuation Report is an in-depth analysis detailing your home's value as well as a comparison with similar homes in the area
Purchase History
We collect this data history from publicly available records. To have your information removed, we recommend requesting removal directly through your county’s website.
| Date | Buyer | Sale Price | Title Company |
|---|---|---|---|
| Rice Mark E | -- | None Available | |
| Rice Mark E | -- | None Available | |
| Rice Mark E | $59,500 | North American Title Co | |
| Rice Mark E | -- | Chicago Title Co | |
| Rice Mark E | -- | -- |
Source: Public Records
Mortgage History
We collect this data history from publicly available records. To have your information removed, we recommend requesting removal directly through your county’s website.
| Date | Status | Borrower | Loan Amount |
|---|---|---|---|
| Open | Rice Mark E | $165,000 | |
| Closed | Rice Mark E | $75,000 |
Source: Public Records
Tax History
| Year | Tax Paid | Tax Assessment Tax Assessment Total Assessment is a certain percentage of the fair market value that is determined by local assessors to be the total taxable value of land and additions on the property. | Land | Improvement |
|---|---|---|---|---|
| 2025 | $2,603 | $200,966 | $104,616 | $96,350 |
| 2024 | $2,603 | $197,026 | $102,565 | $94,461 |
| 2023 | $2,603 | $193,163 | $100,554 | $92,609 |
| 2022 | $2,495 | $189,377 | $98,583 | $90,794 |
| 2021 | $2,460 | $185,664 | $96,650 | $89,014 |
| 2020 | $2,510 | $183,761 | $95,659 | $88,102 |
| 2019 | $2,237 | $180,159 | $93,784 | $86,375 |
| 2018 | $2,203 | $176,628 | $91,946 | $84,682 |
| 2017 | $2,114 | $173,166 | $90,144 | $83,022 |
| 2016 | $2,073 | $169,772 | $88,377 | $81,395 |
| 2015 | $2,011 | $167,223 | $87,050 | $80,173 |
| 2014 | $1,973 | $163,948 | $85,345 | $78,603 |
Source: Public Records
Map
Nearby Homes
- 2019 Pleasant Hill Rd
- 8099 Yule Tree Ln
- 8030 Elphick Rd
- 1136 Mcfarlane Ave
- 3065 Pleasant Hill Rd
- 7420 Woodland Ave
- 755 Watertrough Rd
- 7149 Lynch Rd
- 1173 Gravenstein Hwy S
- 1426 Darby Rd
- 7080 Fellers Ln
- 6800 Redwood Ave
- 5301 Gravenstein Hwy S
- 8086 Bodega Ave
- 7580 Washington Ave
- 0 Bodega Hwy
- 486 S Main St
- 225 Dutton Ave
- 7804 Anthony St
- 285 Neva St
- 1996 Pleasant Hill Rd
- 1892 Pleasant Hill Rd
- 1967 Pleasant Hill Rd
- 2000 Pleasant Hill Rd
- 1970 Pleasant Hill Rd
- 2003 Pleasant Hill Rd
- 1876 Pleasant Hill Rd
- 2039 Pleasant Hill Rd
- 8035 Yule Tree Ln
- 8042 Yule Tree Ln
- 2013 Pleasant Hill Rd
- 1846 Pleasant Hill Rd
- 1840 Pleasant Hill Rd
- 8074 Yule Tree Ln
- 8069 Yule Tree Ln
- 1689 Elphick Rd
- 2105 Pleasant Hill Rd
- 2023 Pleasant Hill Rd
- 2061 Pleasant Hill Rd
- 2074 Pleasant Hill Rd
Your Personal Tour Guide
Ask me questions while you tour the home.