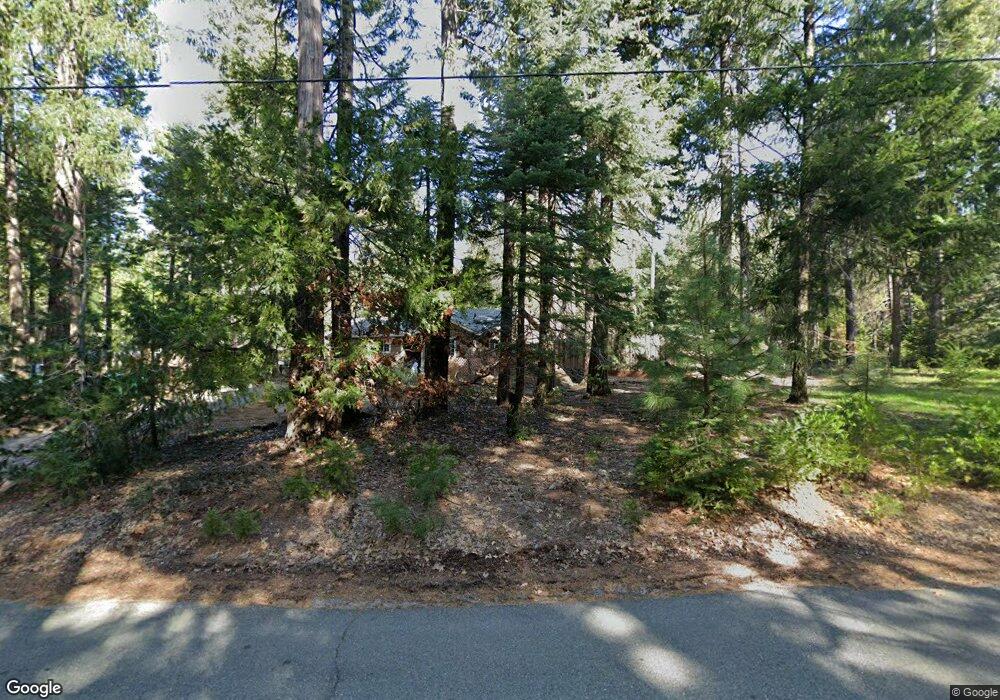
19481 Scotts Flat Rd Nevada City, CA 95959
Estimated Value: $443,290 - $602,000
2
Beds
2
Baths
1,405
Sq Ft
$363/Sq Ft
Est. Value
About This Home
This home is located at 19481 Scotts Flat Rd, Nevada City, CA 95959 and is currently estimated at $509,323, approximately $362 per square foot. 19481 Scotts Flat Rd is a home located in Nevada County with nearby schools including Deer Creek Elementary School and Seven Hills Intermediate School.
Ownership History
Date
Name
Owned For
Owner Type
Purchase Details
Closed on
Aug 22, 2003
Sold by
Richardson Roy C and Dresch Karen L
Bought by
Vavak David W and Vavak Joanne C
Current Estimated Value
Home Financials for this Owner
Home Financials are based on the most recent Mortgage that was taken out on this home.
Original Mortgage
$160,000
Outstanding Balance
$73,931
Interest Rate
6.3%
Mortgage Type
Purchase Money Mortgage
Estimated Equity
$435,392
Purchase Details
Closed on
Oct 26, 1999
Sold by
Trste Downing Rex G and Trste Marjorie L
Bought by
Richardson Roy C and Dresch Karen L
Home Financials for this Owner
Home Financials are based on the most recent Mortgage that was taken out on this home.
Original Mortgage
$52,500
Interest Rate
7.82%
Mortgage Type
Seller Take Back
Create a Home Valuation Report for This Property
The Home Valuation Report is an in-depth analysis detailing your home's value as well as a comparison with similar homes in the area
Home Values in the Area
Average Home Value in this Area
Purchase History
| Date | Buyer | Sale Price | Title Company |
|---|---|---|---|
| Vavak David W | -- | California Land Title Co | |
| Richardson Roy C | $75,000 | Placer Title Company |
Source: Public Records
Mortgage History
| Date | Status | Borrower | Loan Amount |
|---|---|---|---|
| Open | Vavak David W | $160,000 | |
| Previous Owner | Richardson Roy C | $52,500 |
Source: Public Records
Tax History Compared to Growth
Tax History
| Year | Tax Paid | Tax Assessment Tax Assessment Total Assessment is a certain percentage of the fair market value that is determined by local assessors to be the total taxable value of land and additions on the property. | Land | Improvement |
|---|---|---|---|---|
| 2025 | $3,471 | $320,594 | $115,258 | $205,336 |
| 2024 | $3,399 | $314,309 | $112,999 | $201,310 |
| 2023 | $3,399 | $308,147 | $110,784 | $197,363 |
| 2022 | $3,327 | $302,106 | $108,612 | $193,494 |
| 2021 | $3,234 | $296,183 | $106,483 | $189,700 |
| 2020 | $3,224 | $293,147 | $105,392 | $187,755 |
| 2019 | $3,156 | $287,400 | $103,326 | $184,074 |
| 2018 | $0 | $281,765 | $101,300 | $180,465 |
| 2017 | $3,031 | $276,241 | $99,314 | $176,927 |
| 2016 | $2,921 | $270,825 | $97,367 | $173,458 |
| 2015 | $2,877 | $266,758 | $95,905 | $170,853 |
| 2014 | -- | $261,534 | $94,027 | $167,507 |
Source: Public Records
Map
Nearby Homes
- 21678 Scotts Flat Rd
- 19793 Scotts Flat Rd
- 21293 Scotts Flat Rd
- 10973 Scotts Flat Dam Rd
- 10623- Yearling Rd
- 17534 Lightfoot Way
- 11610 Victorian Ct
- 13755 Quaker Hill Cross Rd
- 13518 Quaker Hill Cross Rd
- 13646 Quaker Hill Cross Rd
- 13762 Lightning Tree Rd
- 14014 Red Dog Rd
- 18197 Blue Tent School Rd
- 0 Tay Ln
- 16634 Cooper Rd
- 12834 Spanish Ln
- 12864 Spanish Ln
- 14437 Lightning Tree Rd
- 16448 Pasquale Rd
- 11797 Cedar Springs Rd